The University of Southern Mississippi makes 90 million ocean profiles conversational: AQUAVIEW's approach to the World Ocean Database

Director of Research Development and Scientific Entrepreneurship, University of Southern Mississippi
Director, Institute for Advanced Analytics and Society, University of Southern Mississippi
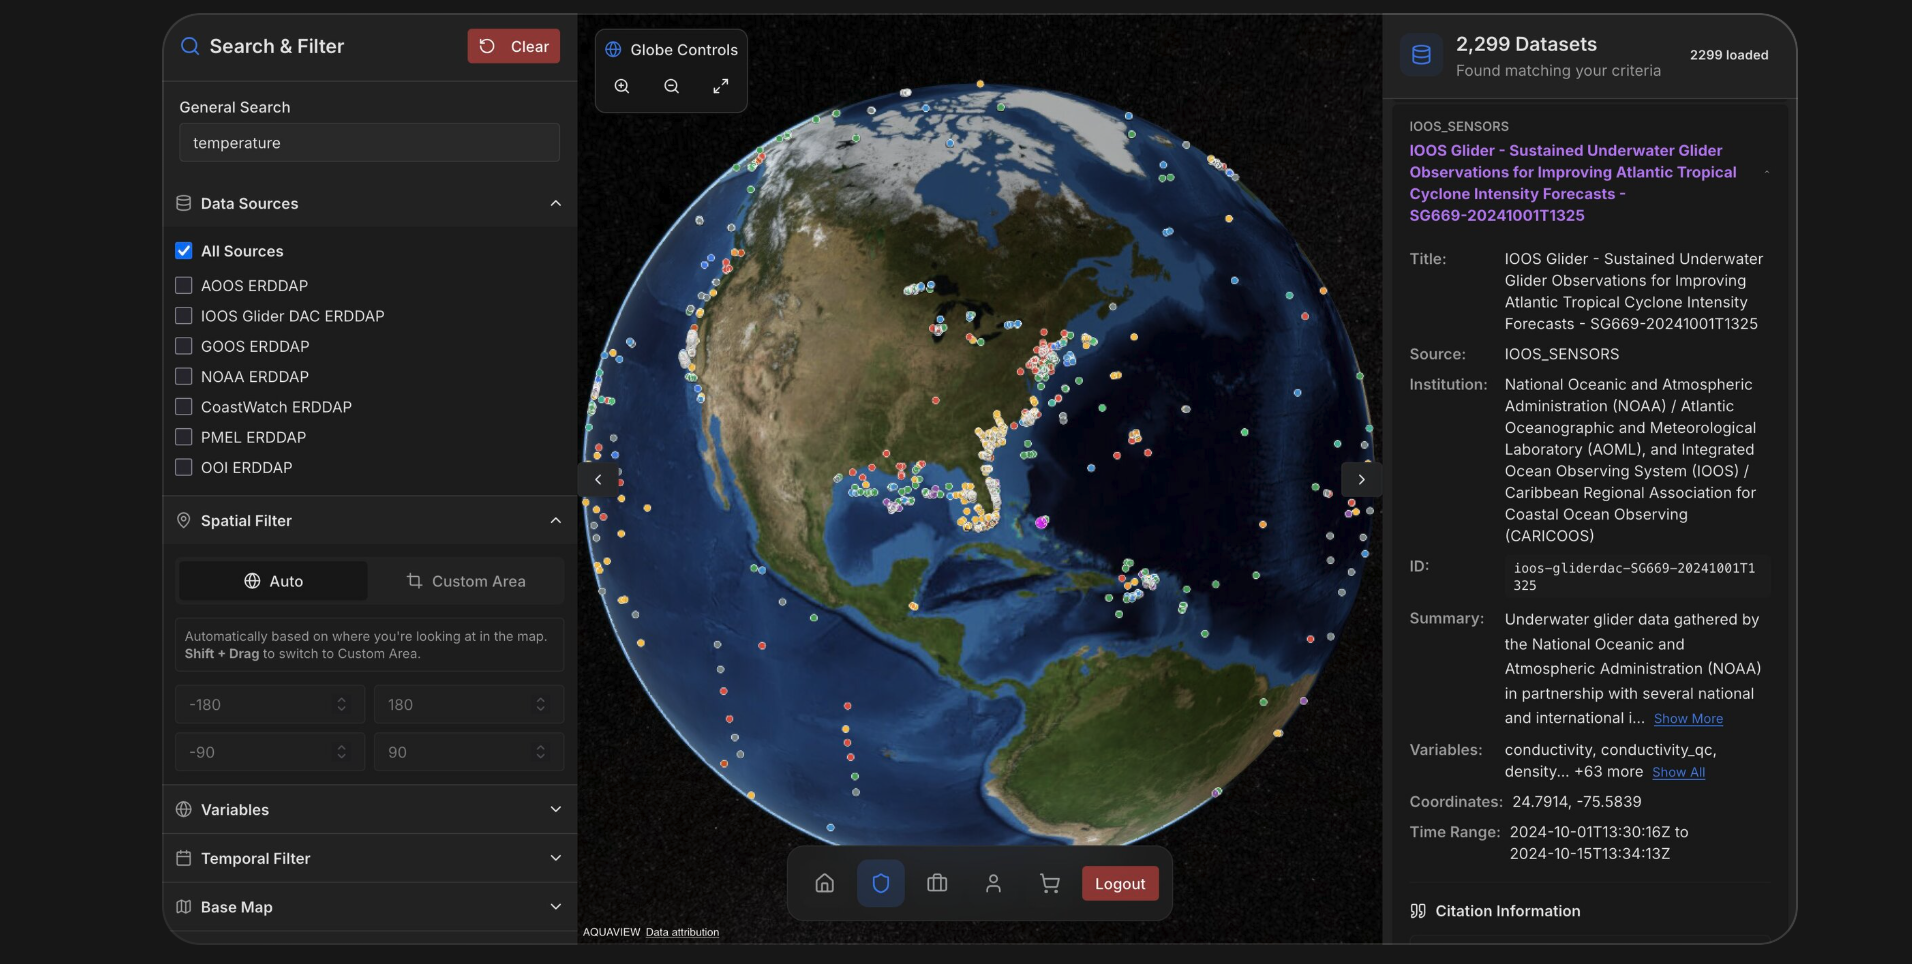
NOAA’s World Ocean Database (WOD) is one of the most comprehensive collections of ocean profile data in the world—90 million profiles spanning over a century of oceanographic observations. Accessing that data, however, has traditionally required specialized technical knowledge and a multi-step, asynchronous workflow. A team at the Institute of Advanced Analytics and Society (IAAS) at the University of Southern Mississippi (USM) has released AQUAVIEW, an ocean data discovery platform funded by NOAA designed to provide unified access to oceanographic and environmental data. The IAAS team set out to change that by restructuring the data, building fast query infrastructure with Arraylake, and adding a natural language interface that makes the entire dataset conversational.
Courtesy University of Southern Mississippi AQUAVIEW
The WODSelect baseline
WODSelect (a NOAA NCEI data product that enables users to retrieve and access World Ocean Database data and receive quarterly updates) has provided searchable access to WOD for years through a web-based interface. The workflow is functional but involves several steps. Users specify search criteria through form fields: geographic bounds in specific coordinate formats, date ranges, instrument types, and variable codes. After submitting the query, WODSelect extracts the matching data and places it on an FTP site; this non-deterministic process can take minutes, hours, or days. Once retrieved, the user receives an email notification that the data is ready, downloads the gzipped files, and then parses the results using custom code or specialized software like Ocean Data View.
This process works reliably, but it consumes time, requires expert knowledge, significant compute resources, and creates immense friction. Each query requires technical knowledge of coordinate systems, variable naming conventions, and file formats. More significantly, every query goes through this asynchronous workflow. If the initial search criteria weren’t quite right, refining the query means starting the entire process again. For exploratory analysis or iterative refinement of research questions, this workflow becomes a significant bottleneck.
Reorganizing by instrument type
AQUAVIEW’s first challenge was structural. WOD data is traditionally organized by year, with each file containing measurements from multiple instrument types: CTD sensors, XBT probes, ocean station data, and more. This administrative organization makes sense for archival purposes but creates practical problems for analytical work.
After discussions with CTO Joe Hamman at Earthmover about these constraints, the AQUAVIEW team considered a different approach: organizing the data around instrument types instead of collection dates. Oceanographers don’t typically think about data chronologically across all instruments. They think in terms of measurement types. CTD sensors provide high-resolution temperature and salinity profiles with characteristic depth ranges and sampling patterns. XBT probes offer rapid temperature measurements with different vertical characteristics. Ocean station data captures fixed locations over extended time periods.
The AQUAVIEW team restructured the entire dataset around these instrument types. This involved converting NetCDF files to Zarr v3 format and reorganizing the data structure into a hierarchy of instrument_type/year, with each instrument-year combination stored as ragged arrays preserving the variable-length depth profiles characteristic of ocean observations. Data is laid out in Arraylake-backed Google Cloud Storage as wod_ragged/{instrument}/{year}. Each instrument type received optimized chunking strategies: typically 10,000 casts per chunk for metadata and automatic chunking for observation data—matched to its unique data characteristics. The reformatted dataset was wrapped with Icechunk for version control and stored in Google Cloud Storage, then integrated with Arraylake’s platform.
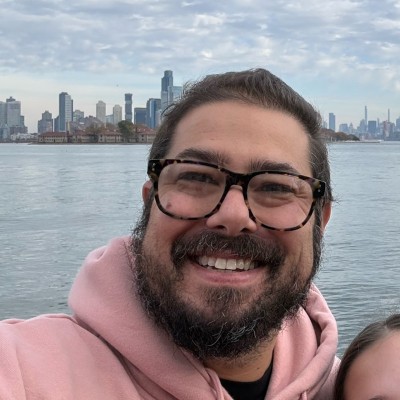
Courtesy University of Southern Mississippi AQUAVIEW
Infrastructure and query performance
Arraylake’s Xarray-based API provided the capability to query the full 90 million profile dataset without loading it entirely into memory. This enabled parallel access across years and instrument types. For most queries, results that would have required the full WODSelect workflow—submitting the search, waiting for extraction, receiving email notification, downloading files—now complete in seconds within the interface.
The performance improvement varies by query scope but typically represents orders of magnitude speedup for common analytical questions. A researcher looking for CTD profiles in a specific region across multiple years can now get results immediately rather than waiting through the asynchronous extraction process. Very large queries that return massive datasets still process asynchronously with email notification, similar to WODSelect, but the vast majority of typical research queries complete instantly.
This speed difference fundamentally changes how researchers can work with the data. Instead of carefully constructing a single perfect query and waiting for results, they can iterate. They can refine geographic bounds, adjust depth ranges, or try different instrument types and see results immediately. The infrastructure makes exploratory analysis practical.
The natural language interface
With fast access to the restructured data established, AQUAVIEW built WOD Chat, a natural language interface using LangGraph and LangChain with Google’s Gemini 2.0 Flash model. The architecture uses a multi-node agent graph with intent routing of the user. The graph routes user intent, parses conversational queries, resolves variables and geography, and executes queries against the Arraylake infrastructure.
The interface architecture follows an agent workflow pattern. A researcher types a question: “Show me temperature data in the Gulf of Mexico region from 1921 to 1925”. The agent first classifies the intent—conversation, variable information request, or data query. For data queries, it extracts variables, location, and temporal range through structured prompts. The geographic resolver maps “Gulf of Mexico region” to bounding box coordinates using a combination of predefined hints and LLM inference. The variable resolver maps user terms to WOD’s canonical variable names. The system then constructs the appropriate API call, executes the query against Arraylake, and returns formatted results with a download link, typically within seconds.
Compare this to the WODSelect workflow for the same question. The researcher would need to:
- Navigate to WODSelect
- Choose the specific search criteria (e.g., “Geographic Coordinates,” “Observation Dates,” “Measured Variables”)
- Specify latitude/longitude bounds in decimal degrees
- Enter start and end dates in the required format
- Select the preferred variables
- Submit and wait for the inventory report generation
- Download the resulting files
- Parse the data format
Potential elapsed time to initial query completion: several working days. And if any parameter needed adjustment—perhaps the geographic bounds didn’t quite capture the region of interest—the entire process would repeat. With WOD Chat, the researcher simply refines the question and gets new results immediately.
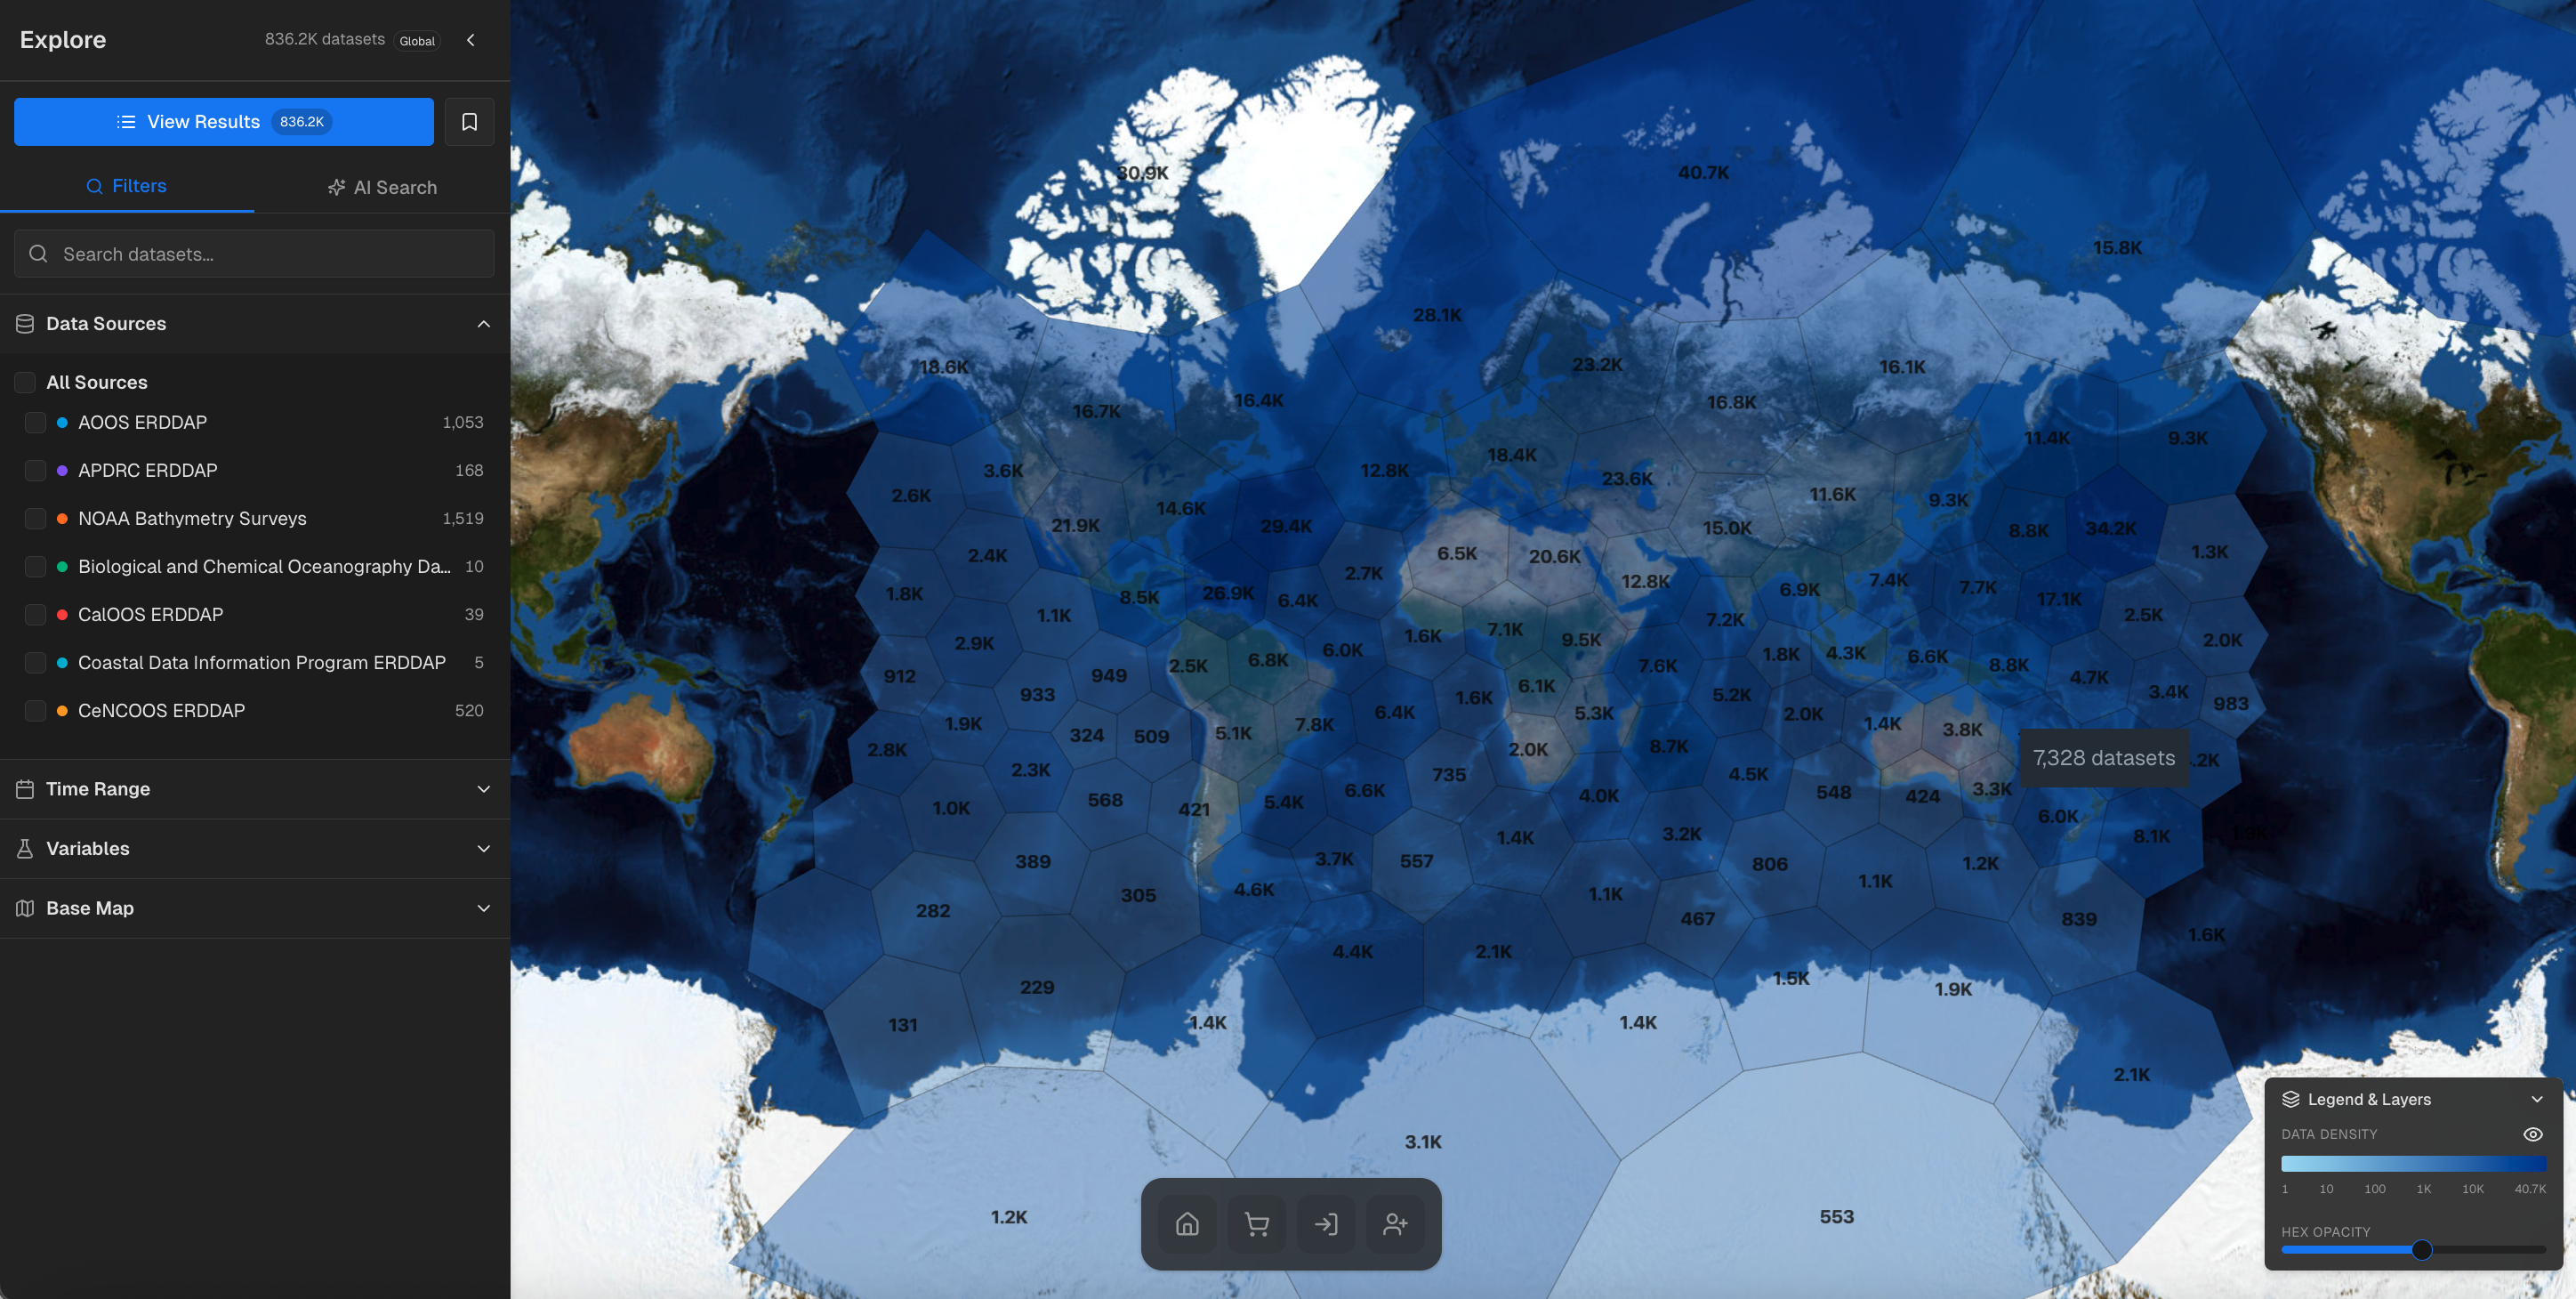
Courtesy University of Southern Mississippi AQUAVIEW
What natural language enables
The value of the natural language interface isn’t primarily about convenience, though that matters. It’s about removing barriers that have limited who could use the data. Traditional WOD access requires knowing coordinate systems, API specifications, data formats, and variable naming conventions. This expertise barrier has always restricted access to those with specific technical training.
The conversational interface makes the data accessible to students learning about ocean circulation, policymakers needing quick information about ocean conditions, and researchers who understand oceanography but not necessarily the technical infrastructure around ocean data archives. More importantly, it radically improves the time scale for certain analytical workflows.
Researchers will be able to use WOD Chat for exploratory analysis, quickly checking whether certain combinations of conditions appear in the dataset before committing to more detailed computational work. Students can explore what kinds of observations exist in different regions and time periods, learning about data coverage and instrument capabilities through interaction rather than documentation. The interface supports questions about the dataset itself—its spatial and temporal coverage, instrument distribution, data density—alongside specific research queries.
Technical implementation
The core architecture involves several integrated components. The data layer uses Zarr v3 format with Icechunk wrapping for version control. The restructuring transformed WOD’s original ragged array format into a hierarchy organized by instrument type and year, with depth stored as a variable since vertical resolution depends on instrument characteristics. Storage uses Google Cloud Storage buckets optimized for the chunk sizes. Arraylake provides the access layer through its Xarray-based API, enabling parallel queries and lazy loading across the full dataset.
The interface layer uses a LangGraph agent built with LangChain and Google’s Gemini 2.0 Flash for natural language understanding. The agent graph routes through specialized nodes—intent classification, query parsing, variable resolution, geographic resolution, temporal normalization, and query execution—each handling a specific aspect of translating conversational requests into API parameters.
For typical queries returning moderate-sized datasets, results stream directly to the interface in CSV format. Very large queries that would return datasets requiring substantial processing trigger asynchronous workflows via Cloud Run Jobs, with email notification when results are ready for download. A complexity scoring system automatically routes queries based on estimated data volume, preserving the ability to handle edge cases while making the common case fast.
What this enables
The combination of infrastructure decisions and interface design transforms a challenging workflow into a fast and accessible one. The instrument-first reorganization aligns the data structure with how oceanographers think about their questions. Arraylake’s infrastructure enables query performance that makes interactive exploration practical. The natural language interface removes technical barriers that have limited access and speeds the process of scientific exploration.
The AQUAVIEW/Earthmover stack makes certain analytical workflows practical that weren’t before. Researchers can prototype analyses in minutes that would have required hours of setup through traditional approaches. They can iterate through questions as they refine their understanding of what they want to know, rather than having to fully specify requirements before beginning analysis. Students and non-specialists can explore one of oceanography’s most comprehensive datasets without first learning the technical infrastructure surrounding it.
The AQUAVIEW team at the IAAS continues to expand the system, exploring integration with additional ocean data sources beyond WOD, supporting more complex analytical queries through the chat interface, and developing connections with Model Context Protocol (MCP) for agentic workflows. The WOD implementation serves as a test case for how large scientific datasets might work with natural language interfaces and AI agents, but the core principle remains straightforward: scientific data should be organized around how researchers think about it, accessible without unnecessary technical barriers, and fast enough to support interactive exploration.
Director of Research Development and Scientific Entrepreneurship, University of Southern Mississippi
Director, Institute for Advanced Analytics and Society, University of Southern Mississippi