Ergonomic seasonal grouping and resampling in Xarray

Forward Deployed Engineer
At Earthmover, we contribute to maintaining and driving forward a range of community open-source projects including Xarray and Zarr. The following post, cross-posted from the Xarray developer blog, describes new API for seasonal aggregation in Xarray.
TL;DR
Two new Grouper objects - SeasonGrouper and SeasonResampler - enable ergonomic seasonal aggregations of Xarray objects. See the docs for more.
The Problem
Xarray has supported seasonal grouping using ds.groupby("time.season") for a very long time. Seasonal resampling has been supported using pandas syntax ds.resample(time="QS-Dec").
These approaches have significant limitations
- Custom season definitions are not possible. This is a very common user request (1, 2, 3, 4, 5).
- The
"time.season"‘virtual variable’ (ortime.dt.season) hardcodes the Northern Hemisphere-centric three-month season definitions namely["DJF", "MAM", "JJA", "SON"]. - The pandas resampling syntax is more powerful but is still limited to three month seasons, even though the start date can be changed (e.g.
QS-Augmeans ‘quarters starting in August’). - A common annoyance with
groupby('time.season')is that seasons come out in alphabetical (nonsensical) order —["DJF", "JJA", "MAM", "SON"]— a consequence of this really being a ‘categorical’ reduction under the hood.
- The
- Seasons spanning the end of the year (e.g DJF) need to be handled specially, in many cases we want to ignore any months in incompletely sampled seasons. As an example, for a time series beginning in Jan-2001 we’d prefer the DJF season beginning in Dec-2000 to be ignored.
- Overlapping seasons are a common request:
["DJFM", "MAMJ", "JJAS", "SOND"].
The Solution
Our new Grouper objects - SeasonGrouper and SeasonResampler - help solve nearly all the above problems by letting user specify seasons using initialisms like DJF or JJAS. All of the GroupBy API is supported (reductions, iteration, map, etc.).
Examples
To illustrate, let us first load in our classic example dataset; two years of air temperature data from a simulation of North America.
>>> import xarray as xr
>>>
>>> ds = xr.tutorial.open_dataset("air_temperature")
>>> ds

<xarray.Dataset> Size: 31MB
Dimensions:  (lat: 25, time: 2920, lon: 53)
Coordinates:
  * lat      (lat) float32 100B 75.0 72.5 70.0 67.5 65.0 ... 22.5 20.0 17.5 15.0
  * lon      (lon) float32 212B 200.0 202.5 205.0 207.5 ... 325.0 327.5 330.0
  * time     (time) datetime64[ns] 23kB 2013-01-01 ... 2014-12-31T18:00:00
Data variables:
    air      (time, lat, lon) float64 31MB ...```
Attributes: (5)
SeasonGrouper
We will use the .count() reduction to illustrate how these aggregations work; it counts the number of non-NaN values in a group.
First, you can now specify custom seasons using initialisms e.g. DJF.
>>> from xarray.groupers import SeasonGrouper
>>>
>>> ds.groupby(time=SeasonGrouper(["DJF", "MAM", "JJA", "SON"])).count()

<xarray.Dataset> Size: 43kB
Dimensions:  (season: 4, lat: 25, lon: 53)
Coordinates:
  * lat      (lat) float32 100B 75.0 72.5 70.0 67.5 65.0 ... 22.5 20.0 17.5 15.0
  * lon      (lon) float32 212B 200.0 202.5 205.0 207.5 ... 325.0 327.5 330.0
  * season   (season) object 32B 'DJF' 'MAM' 'JJA' 'SON'
Data variables:
    air      (season, lat, lon) int64 42kB 720 720 720 720 ... 728 728 728 728
Overlapping seasons are supported:
>>> four_monthly = ds.groupby(time=SeasonGrouper(["DJFM", "MAMJ", "JJAS", "SOND"]))
>>> four_monthly.count()
<xarray.Dataset> Size: 43kB
Dimensions: (lat: 25, lon: 53, season: 4)
Coordinates:
* lat (lat) float32 100B 75.0 72.5 70.0 67.5 65.0 ... 22.5 20.0 17.5 15.0
* lon (lon) float32 212B 200.0 202.5 205.0 207.5 ... 325.0 327.5 330.0
* season (season) object 32B 'DJFM' 'MAMJ' 'JJAS' 'SOND'
Data variables:
air (lat, lon, season) int64 42kB 968 976 976 976 ... 968 976 976 976
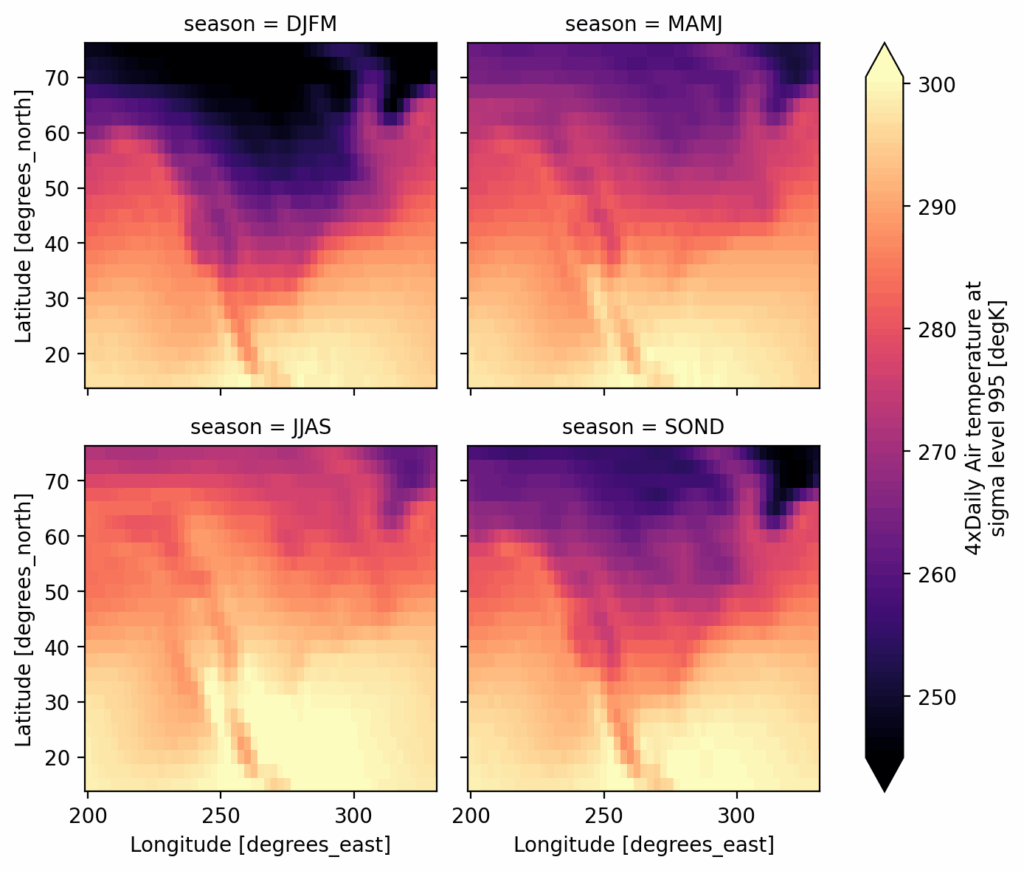
Attributes: (5)Let’s make a plot using FacetGrid!
four_monthly.mean().air.plot(
    col="season", cmap="magma", robust=True, col_wrap=2
)
SeasonResampler
For resampling to a seasonal frequency use SeasonResampler.
>>> from xarray.groupers import SeasonResampler
>>>
>>> ds.groupby(
    time=SeasonResampler(["DJF", "MAM", "JJA", "SON"], drop_incomplete=True)
).count()

<xarray.Dataset> Size: 75kB
Dimensions:  (time: 7, lat: 25, lon: 53)
Coordinates:
  * lat      (lat) float32 100B 75.0 72.5 70.0 67.5 65.0 ... 22.5 20.0 17.5 15.0
  * lon      (lon) float32 212B 200.0 202.5 205.0 207.5 ... 325.0 327.5 330.0
  * time     (time) datetime64[ns] 56B 2013-03-01 2013-06-01 ... 2014-09-01
Data variables:
    air      (time, lat, lon) int64 74kB 368 368 368 368 368 ... 364 364 364 364
Attributes: (5)
Note that the first month starts in 2013-03-01! The incomplete DJF season starting in Dec-2012 is ignored (this datasset begins in Jan 2013). To avoid this behaviour pass drop_incomplete=False
>>> ds.groupby(
    time=SeasonResampler(["DJF", "MAM", "JJA", "SON"], drop_incomplete=False)
).count()

<xarray.Dataset> Size: 96kB
Dimensions:  (time: 9, lat: 25, lon: 53)
Coordinates:
  * lat      (lat) float32 100B 75.0 72.5 70.0 67.5 65.0 ... 22.5 20.0 17.5 15.0
  * lon      (lon) float32 212B 200.0 202.5 205.0 207.5 ... 325.0 327.5 330.0
  * time     (time) datetime64[ns] 72B 2012-12-01 2013-03-01 ... 2014-12-01
Data variables:
    air      (time, lat, lon) int64 95kB 236 236 236 236 236 ... 124 124 124 124
Attributes: (5)
This result starts in Jan-2013!
Seasons need not be of the same length:
>>> ds.groupby(time=SeasonResampler(["JF", "MAM", "JJAS", "OND"])).count()

<xarray.Dataset> Size: 85kB
Dimensions:  (time: 8, lat: 25, lon: 53)
Coordinates:
  * lat      (lat) float32 100B 75.0 72.5 70.0 67.5 65.0 ... 22.5 20.0 17.5 15.0
  * lon      (lon) float32 212B 200.0 202.5 205.0 207.5 ... 325.0 327.5 330.0
  * time     (time) datetime64[ns] 64B 2013-01-01 2013-03-01 ... 2014-10-01
Data variables:
    air      (time, lat, lon) int64 85kB 236 236 236 236 236 ... 368 368 368 368
Attributes: (5)
Multiple groupers
These new Grouper objects compose well with grouping over other arrays (see blog post), for example
>>> from xarray.groupers import BinGrouper
>>>
>>> ds.groupby(
    lat=BinGrouper(bins=2), time=SeasonResampler(["JF", "MAM", "JJAS", "OND"])
).count()

<xarray.Dataset> Size: 7kB
Dimensions:   (lon: 53, lat_bins: 2, time: 8)
Coordinates:
  * lon       (lon) float32 212B 200.0 202.5 205.0 207.5 ... 325.0 327.5 330.0
  * lat_bins  (lat_bins) interval[float64, right] 32B (14.94, 45.0] (45.0, 75.0]
  * time      (time) datetime64[ns] 64B 2013-01-01 2013-03-01 ... 2014-10-01
Data variables:
    air       (lon, lat_bins, time) int64 7kB 3068 4784 6344 ... 4416 5856 4416
Attributes: (5)
How does this work?
Xarray’s GroupBy API implements the split-apply-combine pattern (Wickham, 2011) which applies to a very large number of problems: histogramming, compositing, climatological averaging, resampling to a different time frequency, etc. Here the data are split in to groups, a function is applied to each group, and finally those intermediate results are combined to form the final result. The first step in splitting the data is converting group labels of arbitrary type to integer codes — “factorization”. Xarray’s Grouper objects provide an extension point that allow users and downstream libraries to plug in custom factorization strategies. Here we do exactly that to handle the complexities of seasonal grouping (example). Given the user’s definition of seasons, we construct the appropriate array of integer codes and run the aggregation as usual.
Limitations
SeasonGrouperdoes not support thedrop_incompleteoption yet. This would be a great contribution (issue).SeasonResamplerdoes not support overlapping seasons. This seems much harder to solve.- Rechunking to a seasonal frequency with
SeasonResampleris not supported yet. This would also be a great contribution (issue). Such rechunking is a remarkably useful technique in making climatology calculations much more parallel-friendly. For example:ds.chunk(time=TimeResampler("10YS"))rechunks so that 10 years of data is contained in a single chunk. See these two Pangeo discourse forum posts (1, 2) for applications of this technique.
Summary
Two new Grouper objects - SeasonGrouper and SeasonResampler - enable ergonomic seasonal aggregations with Xarray. The Grouper API is not public yet, but (hopefully) will be soon. If you have a use-case for domain-specific Grouper objects, please open an issue!
Acknowledgments
Many thanks to Thomas Vo and Olivier Marti for contributing any tests, and testing out the pull request. Thanks also to Martin Yeo for contributing a very clever idea on how to do grouping by overlapping seasons.
Forward Deployed Engineer