The Untapped Promise of Weather Radar Data

Data Scientist
Weather radar is one of the most powerful observational tools in atmospheric science. Every few minutes, it captures reflectivity, among other variables, in a sample volume that is rotated forming a high-resolution, four-dimensional dataset (x,y,z,t) that tracks storms in real time, revealing fine-scale structure in the vertical dimension.
At Earthmover, we’re seeing a growing number of organizations starting to work with radar data. For instance, AI weather forecasting startups aim to leverage radar to build better weather forecast models. Other companies, like Rainmaker, are using radar to inform real-time drone missions and monitor cloud-seeding campaigns.
Yet for all its scientific richness, radar data remains trapped in legacy binary formats, making it painful and difficult to work with. Each file contains a 3D volume scan of the atmosphere, composed of multiple elevation sweeps — well-documented, but designed for real-time operations, not scalable scientific analysis. The format lacks standard metadata, query support, or cloud-native structure, making long-term reuse and large-scale processing difficult. To build a time series analysis or train a machine learning model, researchers must first download and parse millions of files.
The data exists, but it’s locked inside outdated formats that make even basic analysis burdensome. And that gap is holding back the very promise of open science: data should be reusable, reproducible, ready to support research, decision-making, and data-driven applications across science and industry.
At Earthmover, we obsess over building cloud-native tooling that makes working with complex multi-dimensional scientific data a breeze. In this series of posts, I explore how such tooling might unlock the immense scientific potential of weather radar data.
This first post traces how radar data is collected, why it became such a fragmented mess, and what a modern, analysis-ready data model could unlock for atmospheric science and beyond.
Radar 101: From Sweeps to 4D Volumes
Most people have seen weather radar in action: animated storms sweeping across a map, red and green velocity patterns hinting at tornadoes, or meteorologists pointing to a “hook echo” live on air. Radar is one of the most recognizable, and powerful, tools in meteorology.
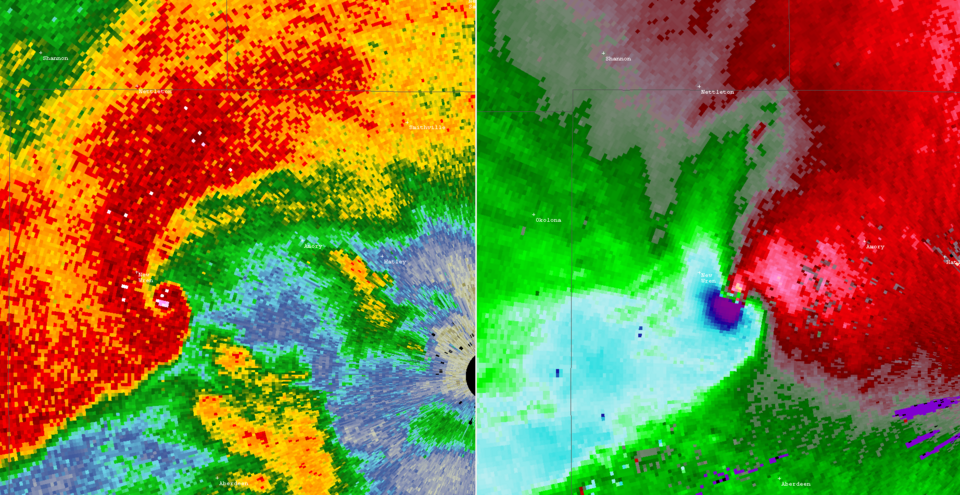
Hook echo associated with a violent tornado near Amory, Mississippi (March 24, 2023). On the left, radar reflectivity shows a classic “hook” shape — a hallmark of tornadic supercells. On the right, radial velocity reveals strong inbound (green) and outbound (red) winds side by side, indicating rotation. Together, these products help meteorologists detect tornadoes in real time.Source: Wikimedia Commons – 3/24/2023 Amory, Mississippi TVS
But behind those familiar visuals lies a stream of complex, multidimensional and multi-variable data — and a surprisingly deep infrastructure challenge. A weather radar doesn’t capture a single image. Instead, it rotates 360° at multiple elevation angles, sweeping out cone-shaped slices of the atmosphere. Each of these slices is called a sweep, and when stacked vertically, they form a Volume Coverage Pattern (VCP) — a 3D volume scan of the atmosphere.
▶️ Watch how it works:How weather radar scans the atmosphere – UCAR animation
This process repeats every 4 to 10 minutes, depending on radar mode, producing a high-resolution, four-dimensional dataset: latitude, longitude, altitude, and time. It’s one of the few observational systems that captures rapidly evolving weather systems in near-real time, including rotating supercells, hailstorms, convective outflows, among others. However, radar detects more than just weather. Its signal can also pick up birds, bats, and insects in motion — data now used in ecology, migration studies, and aeroecology.
If you’re curious about this application, check out this 2024 study on bird migration using weather radar.
Despite the richness of these observations, the way radar data is stored presents serious challenges. Each volume scan is saved as a standalone binary file — typically in polar coordinates (range, azimuth, elevation), with minimal metadata, no native support for time-series access, spatial queries, and ill-suited for cloud-based workflows.
We’ll return to these structural constraints soon, but first, let’s look at what a radar scan contains.
What’s Inside a Radar Scan?
Each radar sweep emits energy and measures how much energy bounces back from objects in the atmosphere. That returned signal is sampled along narrow beams, creating a structured array of measurements — one for each direction and distance from the radar. At a minimum, every sweep records a few core variables:
- Reflectivity (Z): How much energy is reflected, used to estimate precipitation intensity.
- Radial velocity (V): The motion of targets toward or away from the radar, used to detect rotation and wind speed.
- Spectrum width (W): Variability in velocity within a beam, useful for identifying turbulence or non-meteorological echoes.
How radar sees the sky. This animation by Irene Crisologo shows how a weather radar emits pulses of electromagnetic energy and measures the returned signal from targets in the atmosphere — such as raindrops, hail, or snow. Each beam samples the atmosphere along its path, allowing scientists to locate and characterize echoes within the radar’s range. Source: Drawn to Geoscience (AGU blog, 2020).
Modern radars, such as those in the U.S. Next-Generation Radar (NEXRAD) network, use dual-polarization techniques, transmitting both horizontal and vertical pulses. This upgrade, completed nationwide in 2013, enables the radar to measure the shape, size, and consistency of targets, adding a new set of scientific variables:
- Differential reflectivity (ZDR): Difference in returned energy between horizontal and vertical pulses, used to distinguish rain from hail or snow.
- Correlation coefficient (ρhv): Statistical similarity of horizontal and vertical returns, useful for quality control and identifying non-weather echoes.
- Specific differential phase (KDP): Rate of phase shift between polarizations, helpful for estimating rainfall rates and filtering out noise.
These variables are recorded in a polar coordinate system, indexed by range and azimuth.
But not all radar volumes are created equal. Radars use different scanning strategies or VCPs depending on current weather conditions. In clear air mode, radars scan fewer elevation angles (typically from 0.5° to 6°), optimized to detect weak signals like atmospheric boundaries or biological targets. During storms, the radar switches to a precipitation mode, scanning through many more angles (up to 19°) to build a detailed vertical profile of storms. These VCPs are adaptive by design and can even be manually selected by meteorologists at local National Weather Service (NWS) offices based on evolving weather conditions. But that very flexibility leads to structural heterogeneity across files, complicating efforts to treat radar data as a uniform, analysis-ready dataset.
![]()
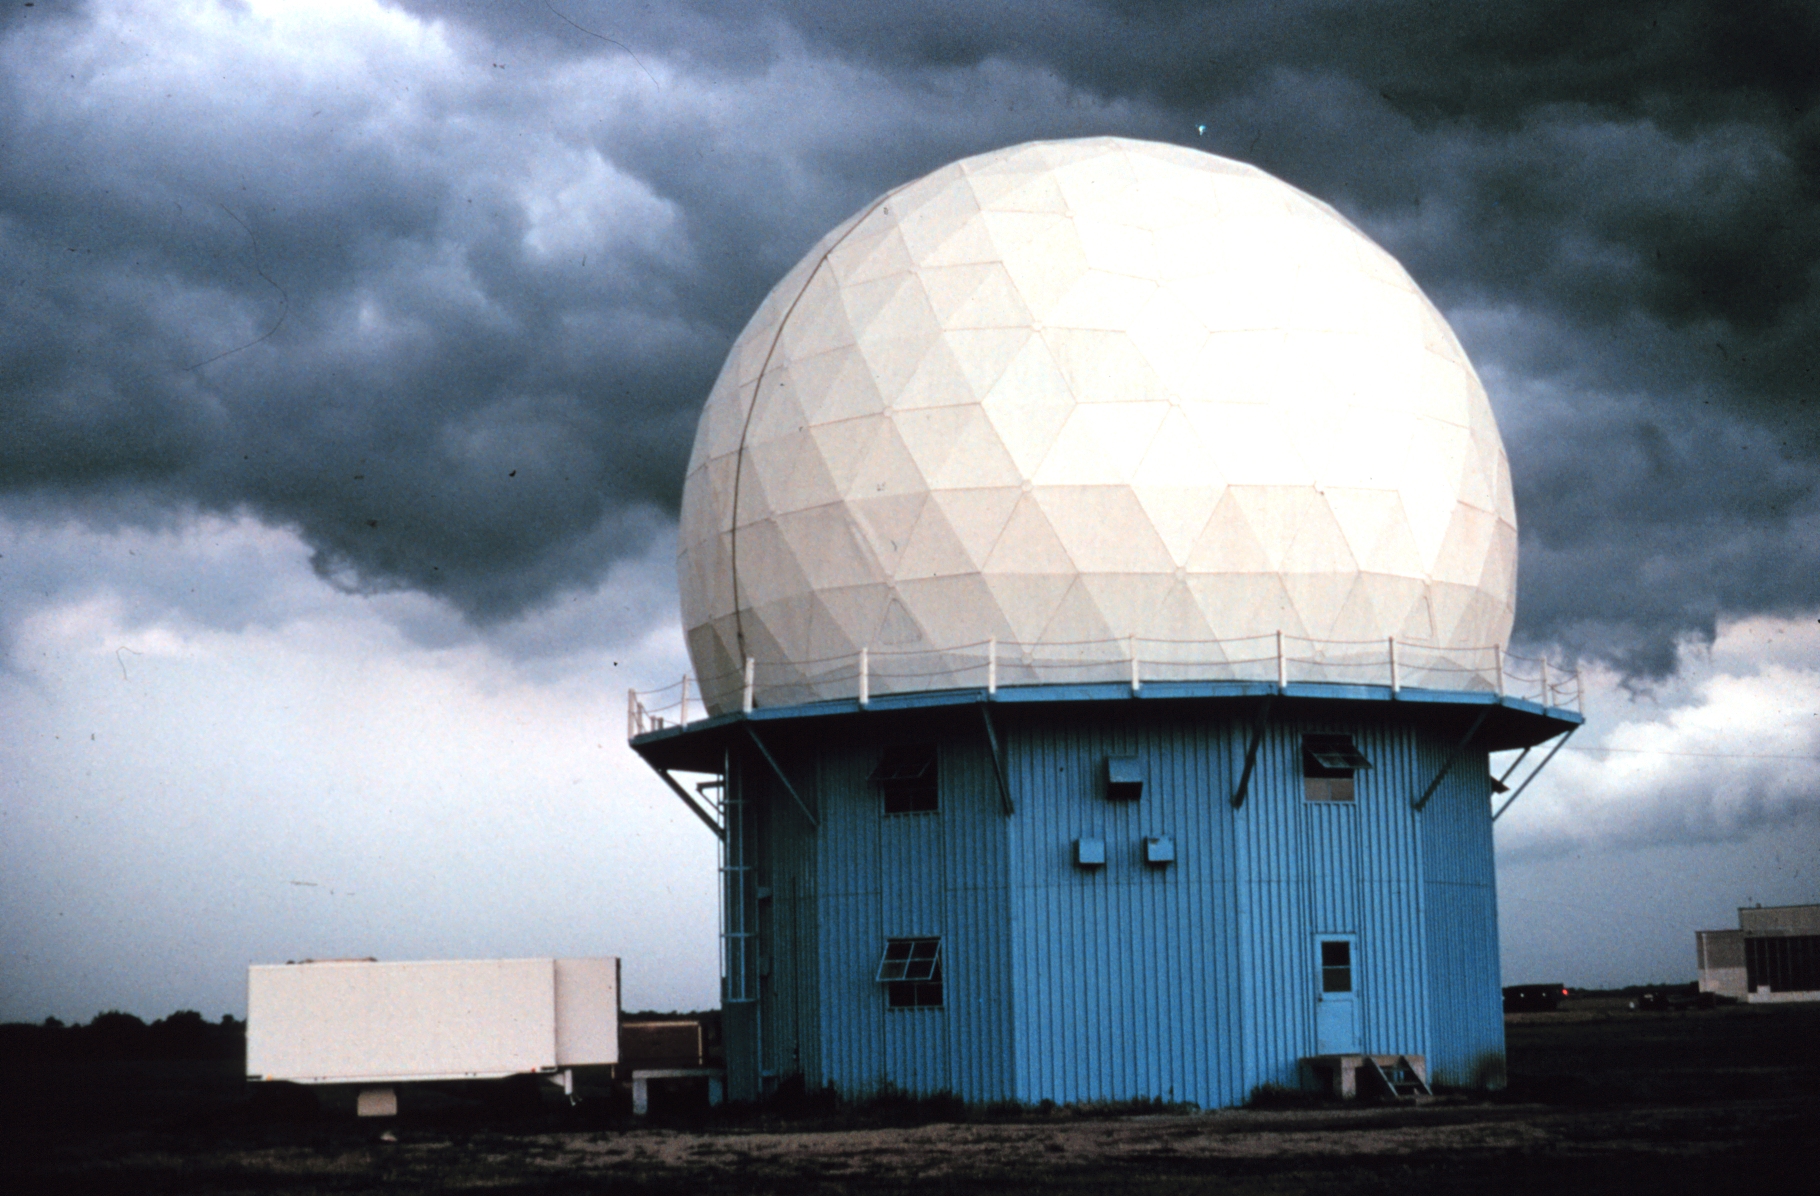
Different weather, different radar scan strategies. Two weather radars under contrasting conditions: Left — Radar operating in precipitation mode during a thunderstorm near New Underwood, South Dakota (2004). In this mode, the radar cycles through a wide range of elevation angles to resolve storm structure in detail. Right — Radar operating in clear-air mode on a calm day in Mayville, North Dakota. Fewer sweeps are used, optimized for detecting weak returns such as atmospheric boundaries or biological targets. These mode shifts — based on Volume Coverage Patterns (VCPs) — are critical for real-time adaptation, but they introduce structural variability that complicates large-scale data analysis. Image credits: Left: NOAA Photo Library / NEXRAD and Thunderstorm in New Underwood, South Dakota (2004). Right: The Dickinson Press / Mayville Weather Radar Tower.
This heterogeneity complicates efforts to build unified datasets. Even with the same radar variables, different VCPs mean different numbers of sweeps, different angles, and inconsistent vertical resolution, all of which must be reconciled during any large-scale extraction or analysis pipeline.
In the NEXRAD Level II archive, each of these volume scans is saved as a separate file. Filenames follow a strict convention (e.g., KCBW20180707_004946_V06), encoding the radar site, date, and timestamp, but this metadata is only usable if you already know how to parse the naming scheme, and there’s no accompanying index or catalog to help. Older files (pre-2014) are gzip-compressed (.gz), while more recent ones are uncompressed binary. Regardless of format, the structure is flat: folders full of small, opaque files.
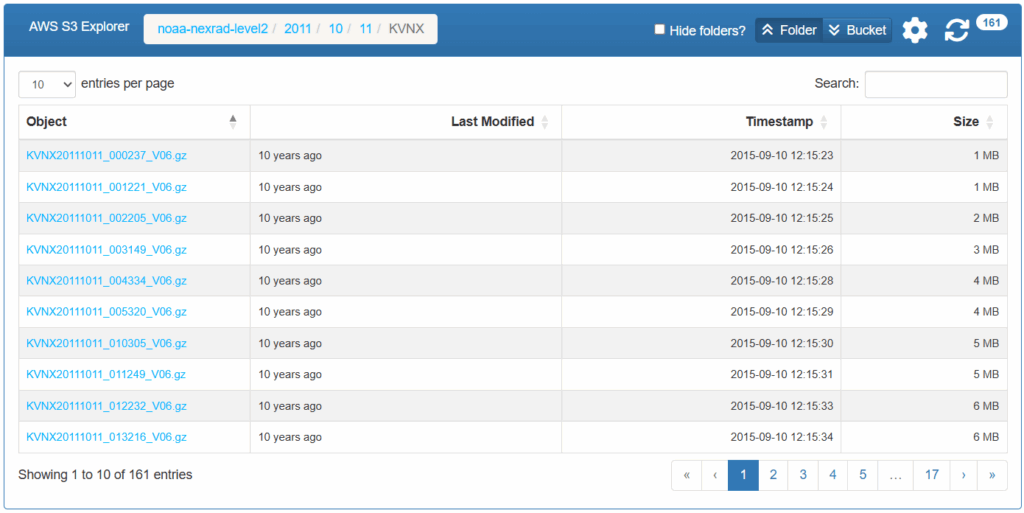
Snapshot of the NEXRAD Level II archive on AWS. Each file corresponds to a full VCP: one radar volume from a specific site and time. Filenames encode metadata, but there’s no index, search, or structure beyond folders. Before 2014, files were .gz; afterward, they are stored as raw binary. Source: NOAA NEXRAD Level II Open Data on AWS
This file-by-file structure reflects how radar was designed for real-time operations, not scalable analysis. There’s no standard schema across archives, no built-in georeferencing, and no support for querying across time or space. Even basic tasks, like extracting reflectivity at the lowest elevation angle for a time series analysis, require decoding, reprojection, and custom tooling.
This structural friction makes it hard to analyze at scale, and even harder to share. Before we can run multi-decadal analysis or train AI models, we need a better way to represent and access what’s already there.
Yet despite these limitations, radar data is already powering life-saving systems in real time. In the next section, we’ll look at how raw files are decoded, transformed, and rendered into the weather maps we see on screens, and what gets lost in the process.
From Raw Files to Public Maps
Before radar data reaches the public, through weather apps, television broadcasts, local National Weather Service (NWS) offices, or aviation dashboards, it goes through a fast, highly automated processing pipeline designed for real-time use.
From raw scans to public products. Each radar volume scan (VCP) is saved as a raw binary file. That file powers a real-time pipeline of decoding, filtering, georeferencing, and rendering. The outputs feed into weather apps, aviation tools, emergency warnings, and more — but are optimized for live use, not long-term scientific analysis.
The process begins at the radar itself scanning the atmosphere continuously. Each volume is saved as a standalone binary file, typically in formats like Level II (as used by NEXRAD), and made available for dissemination.
From there, institutions that want to generate products — whether for forecasting, aviation, or public display — must run their own processing pipelines. This typically includes:
- Decoding: Specialized software reads the binary files (e.g., Level II) and extracts radar measurements.
- Georeferencing: Transforms the data from its native polar coordinate system (range, azimuth, elevation) into geographic coordinates (latitude, longitude, altitude).
- Filtering: Algorithms remove non-meteorological echoes, such as returns from birds, insects, buildings, or ground clutter.
- Compositing (if needed): Merges data from neighboring radars into broader regional or national views, enhancing spatial coverage and context.
- Rendering: Converts processed values into visual products — like animated reflectivity loops, velocity maps, or precipitation overlays — and delivers them to public interfaces like weather apps or broadcast graphics.
Radar in action. Reflectivity image from the Lake Charles radar station during Hurricane Rita (2005). Real-time radar products like this are generated from raw volume scans within seconds, powering emergency alerts, aviation decisions, and public awareness. Source: NOAA / National Weather Service via Wikimedia Commons.
These workflows are fast, automated, and deeply integrated into operational forecasting systems. They are optimized to transform single radar files into actionable insights almost instantly, enabling meteorologists to issue warnings and updates in real time.
However, those wishing to use Radar data for other purposes, such as research or machine learning, have to struggle to process and transform the data.
Radar data as a Stress Test for Scientific Infrastructure
The challenges of radar data aren’t just technical; they’re structural. Radar data sits at the intersection of several hard problems in scientific computing: large volumes of high-resolution spatiotemporal data, inconsistent formats, and legacy pipelines optimized for live use, not long-term reuse.
In that sense, radar is more than a meteorological dataset; it’s a stress test for how we manage complex scientific data at scale. The files are open, and in some cases, findable through cloud buckets. But access still requires technical expertise, and the data isn’t interoperable or reusable in any scalable way. There’s no consistent metadata, no standard structure, and no way to extract small subsets without downloading full files. The result is duplication, inefficiency, and missed scientific potential.
Radar is more than a meteorological dataset; it’s a stress test for how we manage complex scientific data at scale.
The information is rich, but rarely reusable. In short, radar data is not FAIR.
FAIR stands for Findable, Accessible, Interoperable, and Reusable, a set of guiding principles for scientific data stewardship. Radar often meets the letter of these goals, but rarely the spirit:
- Findable? Yes, if you know which bucket to search and how to parse filenames.
- Accessible? Technically, but only with specialized knowledge and tooling.
- Interoperable? Not really, formats and metadata vary across networks and archives.
- Reusable? Barely, without structure or standardization, large-scale reuse is limited.
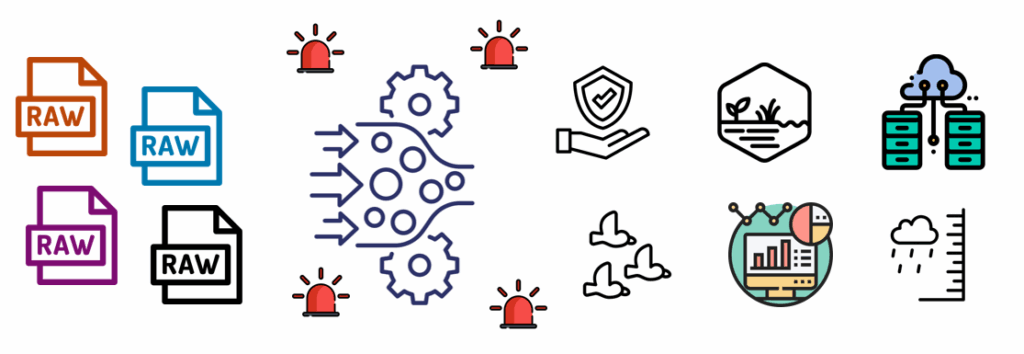
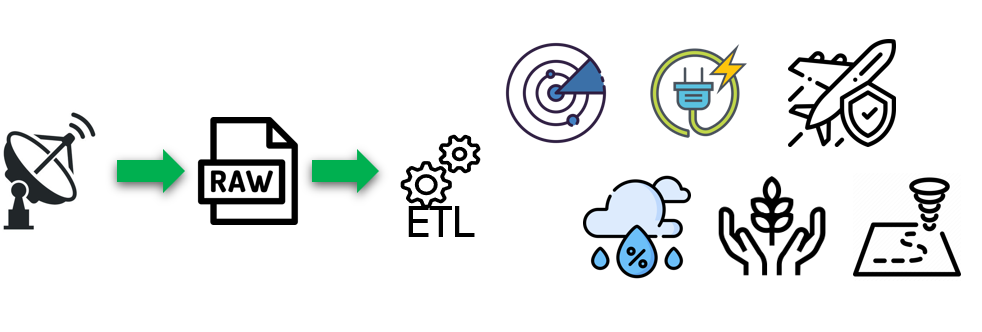
Scaling pain points. Radar data is publicly available, but fragmented across millions of raw binary files. Long-term applications, from climate analysis to machine learning, require downloading, ingesting and decoding vast volumes of data, often with custom pipelines and repeated effort. Without scalable infrastructure, the path from raw data to insight is filled with bottlenecks
The lack of FAIR principles in radar data doesn’t just slow down research, it limits what’s even possible. Without scalable access to radar time series, we’re missing major opportunities across a range of disciplines. In climatology, fragmented archives and inconsistent quality control hinder the development of long-term records of precipitation extremes and storm frequency (Saltikoff et al., 2019). In machine learning, the lack of standardized, structured data hinders model training for storm classification, hail prediction, or weather nowcasting. Agricultural planning loses out on high-resolution rainfall data that could support crop yield models and irrigation decisions, among many other potential applications.
To unlock radar’s scientific potential, we need more than open access. We need a data model that describes the structure of the atmosphere as clearly as it stores the measurements, one that can scale to billions of observations, support queries across time and space, and work natively in the cloud.
Radar Data Challenges are Global
The challenges with radar data aren’t limited to file formats or local infrastructure, they’re global, systemic, and deeply tied to how radar observations are shared and maintained worldwide. According to the latest World Meteorological Organization (WMO) radar database, more than 800 weather radars are currently operational across over 90 countries, forming one of the most comprehensive atmospheric sensing networks on Earth.
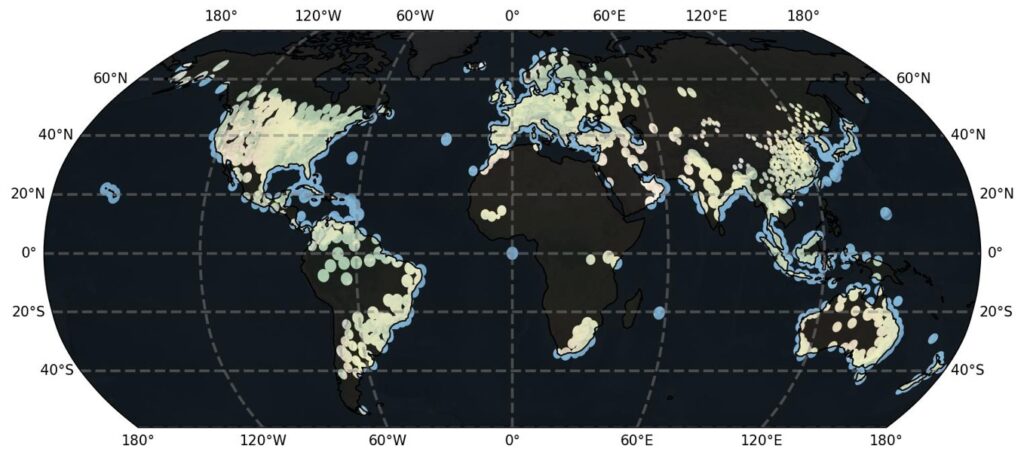
Global radar coverage. Each dot represents an active radar site listed in the WMO Radar Database, with estimated coverage areas. While more than 800 radars are in operation globally, only a fraction of the data is publicly available, and even less is analysis-ready or FAIR-compliant.
But while the physical coverage is vast, data availability is still limited. Fewer than 20% of these radars provide openly accessible archives. Only a handful of national meteorological agencies — including the U.S. (NEXRAD), Finland (FMI), and Colombia (IDEAM) — offer public access to their data. Even then, “open” often means downloadable in raw binary form, not FAIR.
Many global archives rely on proprietary formats, lack standardized metadata, and store files without indexing or structure. This makes integration across countries difficult, slows international research, and keeps radar from reaching its full scientific potential. The rest? The data might exist, might be restricted, offline, or buried in hard-to-access institutional archives. These barriers limit everything from cross-border flood forecasting to hemispheric climate reanalysis.
Still, the opportunity is real. As more countries modernize radar systems and invest in digital infrastructure, there’s a growing chance to align on open standards, cloud-native formats, and interoperable data models. Radar already captures the atmosphere in stunning detail, now we need the tools and policies to make that vision truly global.
Radar as a FAIR Science Case Study
While rooted in meteorology, the radar data challenge reflects patterns seen across many fields that depend on large-scale observational data. At its core, it raises a familiar question: how do we transform fragmented, high-dimensional measurements into structured, reusable information, at scale?
Radar is a powerful example of where FAIR principles are most urgently needed. It’s high-volume, high-velocity, and high-dimensional. It requires rich metadata, precise georeferencing, and cross-platform interoperability.
That makes radar a compelling case for rethinking how we store and serve scientific data, not with more compute, but with better formats, richer metadata, and models built for analysis. Key elements of this shift include:
- Dataset-first design: moving beyond single binary files to structured, queryable collections
- Cloud-native formats: enabling efficient access in cloud bucket storage supporting subsetting, lazy loading, and parallel processing
- Metadata-rich: no need for external docs or decoding tools
- Analysis-ready: preprocessed, standardized, and ready for scientific use
- Standard-compliant structure: following Climate and Forecast (CF) conventions
- FAIR by design: empowering open, reproducible, and scalable science
What makes radar powerful isn’t just what it measures, it’s what we can do with it, if the data is structured right. Moving beyond legacy formats opens the door to truly reusable, scalable science.
Looking Ahead: What If Radar Were Easy to Use?
Radar already gives us one of the most detailed observational records of the atmosphere. But for most researchers, tapping into that record still requires downloading binary files, building custom pipelines, and navigating undocumented formats. What if it didn’t?
In the next post, we’ll explore the tools and standards that are beginning to reshape radar workflows, like the FM-301 data model developed by the Joint Expert Team on Operational Weather Radar (JET-OWR) at the World Meteorological Organization, the Xradar Python library for structured access, and cloud-native formats like Zarr that enable scalable, analysis-ready datasets.
Together, these technologies point toward a different kind of future, one where radar data isn’t just stored, but truly usable:
- Where scientists can analyze decades of observations without writing custom ETL scripts
- Where educators can use real radar data in classrooms, without downloading petabytes
- Where AI models can learn from clean, structured time series instead of fragmented binary files
And where scalable, FAIR-aligned access finally unlocks the broader potential of radar — not just for meteorology, but for climate science, agriculture, ecology, and machine learning.
Radar is already one of the most powerful observational tools in atmospheric science. With the right data model, it could become one of the most valuable datasets in modern science.
At Earthmover, we’re building tools to make that future possible, turning raw, complex sensor data into scalable, structured datasets that support open science, AI-ready workflows, and reproducible research.
References
Saltikoff, E., Friedrich, K., Huuskonen, A., Lengfeld, K., Werner, M., Chandra, M., … & Becker, A. (2019). An Overview of Using Weather Radar for Climatological Studies: Successes, Challenges, and Opportunities. Bulletin of the American Meteorological Society, 100(12), 2253–2270. https://doi.org/10.1175/BAMS-D-18-0166.1
Data Scientist