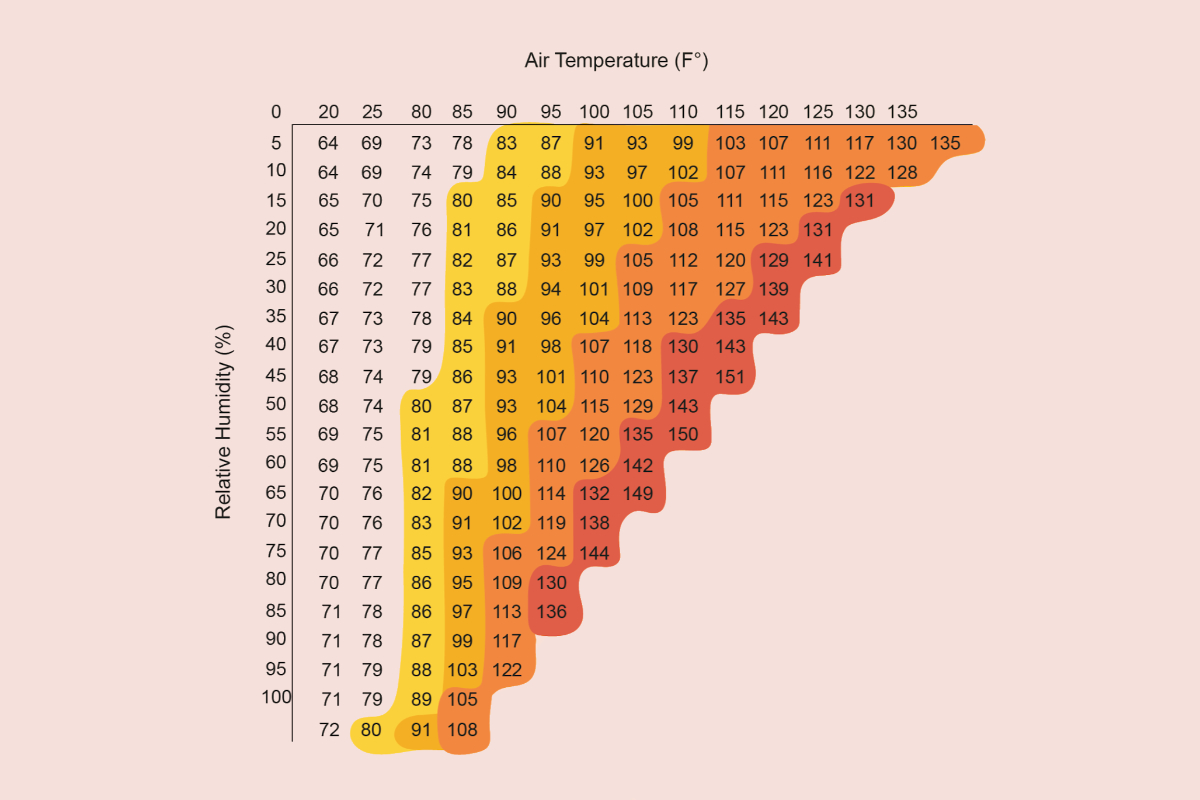
Plotting NYC heatwaves during NYC Climate Week
Calculating climate risk metrics from ERA5 using Arraylake, Icechunk, and Xarray. Just show me the notebook! It’s here. Intro This year at NYC climate week it’s been pretty hot and humid outside. This felt ironically appropriate while we ran a participatory workshop “Open Data in Applied Risk Analys

Tom Nicholas
Software Engineer