From Files to Datasets: FM-301 and the Future of Radar Interoperability


Data Scientist
At Earthmover, we’re interested in weather radar data for two reasons:
- First, radar data are uniquely valuable for our customers thanks to their ability to characterize precipitation, atmospheric turbulence, and phenomena like tornadoes and hurricanes in real time with fine spatial and temporal resolution. These data inform a wide range of critical applications: from NOAA’s hurricane warnings to Rainmaker’s cloud seeding campaigns.
- Secondly, radar data exemplify what we call “scientific data”: highly complex signals produced by advanced sensors, requiring specialized processing and expert knowledge to interpret correctly.
We’re obsessed with data like this–which doesn’t fit into either traditional relational databases or into the standard “geospatial” model of vector / raster data–yet nevertheless possess an underlying structure and coordinate system. This type of data is best served by the array data model—and at Earthmover, we are building the cloud native data platform for array data of all kinds.
In 2019, the World Meteorological Organization (WMO) surveyed 45 national weather services about their radar archives. The results, summarized by Saltikoff et al. (2019), were striking: “Most archiving procedures are not standardized.” More than half of the surveyed agencies store only raw vendor binaries or display products. Fewer than 20 provide structured access to the underlying radar scans.
The result is a fragmented archive: billions of radar files, scientifically rich, but scattered across tapes and cloud buckets, and difficult to access, decode, or reuse at scale.
As Saltikoff and colleagues note, “Radar data are often not archived in a format that is suitable for long-term reuse… there is a lack of standards for formatting, metadata, and quality control.” This global assessment reinforces the core point of Post #1: radar’s fragmentation prevents data from being truly reusable or interoperable, and limits its ability to support scalable research, operational decision-making, and AI-powered tools across disciplines.
Millions of files remain scattered—each requiring custom parsers and deep domain knowledge just to peek inside. Whether it’s a climate study, a machine learning model, or a rainfall trend analysis, the story is the same: weeks or months of decoding and preprocessing before the first line of scientific code is even written.
At this point, the bottleneck isn’t storage or computing power. It’s structure!
Before radar science can scale, we need data that describes itself, works with existing tools, and follows scientific conventions. The WMO—the global authority on atmospheric data exchange—has taken on this challenge by endorsing new open standards designed to make radar data interoperable and analysis-ready.
But a standard on paper isn’t enough. Turning it into something researchers can actually use requires software. That’s why open-source tools like Xradar have become essential: they implement these standards in practice, turning raw scans into structured datasets ready for analysis, modeling, and visualization.
To solve the structural fragmentation of radar archives, the radar science community needed a common foundation—a data model to unify these fragmented files into reusable datasets.
In this post, we’ll look at the WMO’s FM-301 standard for radar and lidar data, and how tools like Xradar are bringing structure to radar workflows, bridging the gap between real-world files and FAIR, cloud-ready datasets. These open-source efforts lay the groundwork for scalable, reproducible radar science, but the data remains scattered, even if now standardized. That’s the challenge we’ll take on in our next post: how to transform fragmented radar files into continuous, cloud-optimized datasets ready for analysis at scale.
What is FM-301?
To make radar data analysis-ready, we first need to define what a radar file should contain—not just the measurements, but also their meaning, context, and structure. That’s the role of FM-301, a data exchange profile developed by the Expert Team on Operational Weather Radar (ET-OWR) under the WMO. Finalized in 2023 and published in the WMO Manual on Codes (WMO-No. 306, Volume I.3), FM-301 formalizes how radar and lidar data should be stored and described for long-term reuse and global exchange.
FM-301 didn’t emerge in a vacuum. It builds on over two decades of community-driven progress toward open data formats. Earlier standards like ODIM_H5 (based on HDF5, widely adopted in Europe) and CfRadial (based on netCDF, used extensively in North America) laid the foundation. CfRadial2.1, a recent evolution of the NetCDF-based approach, introduced a nested group hierarchy to represent radar and lidar volumes.
FM-301 builds on CfRadial2.1 and extends it—adding required metadata fields, standardized variable names, naming conventions, and compliance rules. It effectively codifies CfRadial2.1 as a WMO-backed global exchange profile, enabling interoperability across national weather services, research institutions, and open-source tools.
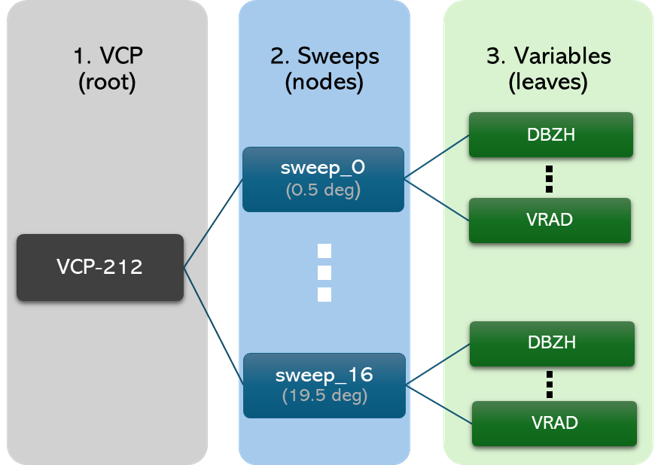
Hierarchical structure of the FM-301 (CfRadial2.1) data standard, illustrated with a NEXRAD VCP-212 scan. At the root level, global metadata defines the volume scan (e.g., site, instrument, time range). Each sweep group corresponds to a fixed elevation angle within the VCP and contains coordinate variables like azimuth and range, along with metadata such as sweep mode and fixed angle. Within each sweep, radar measurements—such as reflectivity (DBZH) and radial velocity (VRAD)—are stored as 2D arrays indexed by ray and range bin. This structure ensures radar files are self-describing, portable, and analysis-ready for scientific workflows.
Technically, FM-301 is built on the NetCDF format and aligned with Climate and Forecast (CF) metadata conventions. It defines a hierarchical structure that mirrors how radars observe the atmosphere
- Volume (Root level): The top-level object, stored in the NetCDF root group. Contains global attributes and ancillary variables relevant to the entire radar scan cycle (e.g., site location, time coverage, platform and instrument metadata).
- Sweep groups: Each sweep represents a fixed-elevation (or fixed-parameter) scan, stored in a dedicated NetCDF group named /sweep_n. Sweep groups contain:
- Dimensions: time (number of rays), range (number of bins), and frequency.
- Coordinate variables: such as azimuth, elevation, time, and range.
- Ancillary metadata: including sweep_mode, fixed_angle, scan_rate, and radar control parameters.
- Dataset variables (within sweep groups): The actual radar measurements—e.g., reflectivity (DBZH), radial velocity (VRADH), differential phase (PHIDP)—are stored as 2D arrays with dimensions (time, range). Each variable is fully self-describing with standard names, units, and optional attributes for QC and folding behavior.
This structure doesn’t just organize the data—it makes it self-describing. Each variable carries the metadata needed to interpret it, which is critical for long-term reuse, reproducibility, and automated workflows.
But FM-301 isn’t meant to replace legacy formats. Instead, it extends them, capturing community best practices in a robust, standards-compliant schema. It reflects a broader shift: from radar as a real-time visualization tool toward radar as a durable, structured scientific dataset.
That structure opens the door to better tooling and interoperability. But it doesn’t change the fact that the data still lives in individual files—millions of them. FM-301 tells us how those files should be organized, but not how to search across them, combine them, or treat them as a coherent dataset. For that, we need tools that go beyond formatting—and we’ll get there in post #3.
First, let’s look at how FM-301 is being implemented in practice.
Xradar and the Community Effort to Make Radar Data Usable
FM-301 defines how radar data should be structured, but it doesn’t parse files or make them usable on its own. That’s where open-source tooling comes in. Over the past few years, contributors across the radar community—including developers of packages like Wradlib, Xradar, and Py-ART—have worked toward a shared goal: enabling reproducible, analysis-ready workflows built on a common data model.
Xradar fills a focused role in this ecosystem. It provides a lightweight, standards-aligned entry point that reads raw radar files into structured, metadata-rich datasets based on FM-301. Built on top of xarray-datatree, Xradar turns fragmented binary scans into self-describing DataTree structures that reflect FM-301’s hierarchy: global metadata at the root, nested sweeps as labeled groups, and measurement fields as CF-compliant arrays. This turns radar data from a raw binary blob into a fully navigable scientific dataset—without byte offsets, lookup tables, or vendor-specific decoding.
This convergence was formalized at the European Radar Conference (ERAD) 2022, where contributors from across the open radar science community agreed to align around a shared data model. The goal: enable FM-301-compliant tools to serve as a common foundation, so that packages like Wradlib, Py-ART, and others could interoperate without reinventing the file-reading layer.
Working with Xradar: A Practical FM-301 Workflow
Once FM-301 defines how radar data should be structured, tools like Xradar make that structure usable in practice. Below is a simple example showing how to load, inspect, and plot a NEXRAD Level II radar file using Xradar python library.
This workflow demonstrates how FM-301’s hierarchy translates into code—not just for file loading, but for georeferenced plotting and variable inspection.
Load a Radar File
This reads a raw binary file and returns an xarray.DataTree that mirrors FM-301’s structure:
- A root group with global metadata
- Nested child groups for each sweep
- Structured arrays with labeled dimensions and coordinates
You can inspect the immediate children of the tree:
Example output:
Inspecting the Root Group
At the root level (/), we find metadata that describes the radar volume as a whole—such as location, instrument type, time coverage, and scan name. This metadata provides the essential context for interpreting the scan and is preserved as global attributes in FM-301.
Accessing a Specific Sweep
Each sweep_n group corresponds to a specific elevation angle in the radar’s volume coverage pattern (VCP). The group includes coordinate variables like azimuth and range, along with radar measurements (e.g., reflectivity, differential phase) stored as 2D arrays. Metadata like sweep mode and fixed angle are also included.
Exploring a Radar Variable
This command returns the reflectivity field (DBZH) from the first sweep. The array is indexed by azimuth and range and comes with standardized metadata such as standard_name, units, and long_name. These conventions ensure that the variable is self-describing and can be interpreted correctly by both humans and software.
Output shows a 2D DataArray with full metadata:
Quick Visualization
You can create a quick diagnostic plot using xarray’s built-in plotting tools:
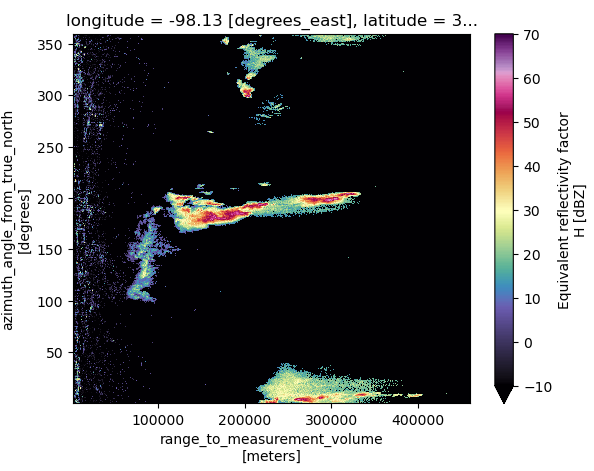
This produces a rectangular image (azimuth × range), useful for inspecting signal structure. But it doesn’t reflect the actual spatial geometry of the radar beam.
Plot in True Spatial Coordinates
To generate a radial (or Cartesian) plot that reflects the actual geometry of the scan, you need to apply xradar’s georeferencing method. This adds derived x, y, and z coordinates based on radar location and sweep geometry:
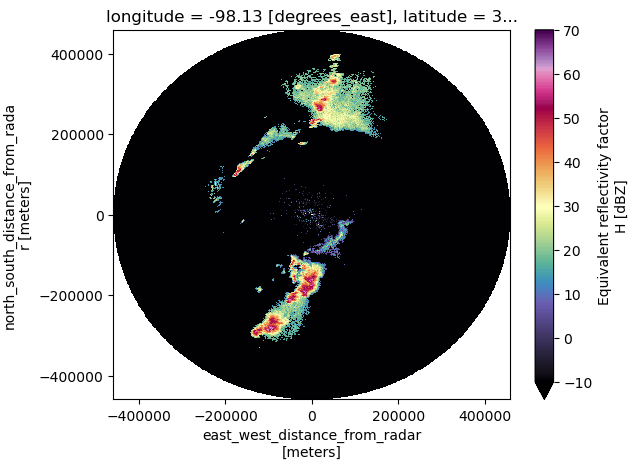
Georeferencing adds derived spatial coordinates based on radar location and sweep angle—essential for spatial analysis and mapping.
Exporting to Zarr
Because Xradar builds on the xarray and xarray-datatree ecosystem, radar volumes in memory can be written directly to Zarr, a chunked, compressed format that supports scalable access in cloud environments.
This preserves the full FM-301 hierarchy:
- Global metadata at the root
- Sweep groups and variables as nested Zarr groups
- Coordinate and attribute metadata as CF-compliant
Storing radar data in Zarr format makes it easier to:
- Persist structure beyond the session
- Serve analysis-ready volumes over object storage
- Integrate with Dask for parallel, lazy access
This doesn’t solve the fragmentation problem on its own—each Zarr store still represents one radar VCP. But it’s a step toward treating radar data as a scalable, queryable archive. That’s exactly what we’ll explore next.
Learn More
The Xradar Examples Hub includes additional workflows for:
Custom file readers
- Slicing data by azimuth, range, or time
- Georeferencing and plotting
- Exporting to different formats
- Integration with Py-Art, Wradlib, Dask, and cloud workflows
Each example builds on the FM-301 hierarchy—showing how standards and open-source tools are converging to support better radar science.
Toward the Radar DataTree
The next step is to treat radar data not just as structured files—but as structured datasets. This led to the development of the Radar DataTree: a hierarchical model built with xarray-datatree that organizes entire radar collections into navigable, time-aware structures. The model is currently under active development as part of a broader effort to formalize scalable radar data archives (Ladino-Rincon et al., 2025, in prep.).
- Each node represents a specific radar scan (VCP), preserving its sweep geometry and metadata.
- Child sweeps are aligned and concatenated along the time axis to build continuous time series.
- The entire DataTree can then be exported to Zarr—making it cloud-native, chunked, and ready for distributed computing.
- This approach turns fragmented radar files into a single, scalable dataset: geospatial, temporal, and analysis-ready.
What’s Next
At Earthmover, this is more than an academic exercise—it’s a core design challenge. We’re building the infrastructure to turn radar data into cloud-native datasets that support real-time insight, long-term analysis, and open collaboration. By aligning with community standards like FM-301 and building on tools like Xradar, we’re closing the gap between raw observations and scalable science.
In the final post of this series, we’ll show how the Radar DataTree powers scalable workflows—like computing Quasi-Vertical Profiles across hundreds of scans—and achieves up to 1 order of magnitude speed up over traditional file-by-file methods.
We’ll also discuss how this approach supports:
- FAIR data principles (Findable, Accessible, Interoperable, Reusable)
- Cloud-native architecture
- Reproducible science at scale
Thanks to tools like Icechunk, this model also supports ACID-compliant transactions—ensuring safe, versioned updates to large radar datasets without corrupting metadata or breaking workflows. That means radar archives can evolve safely—just like any modern, cloud-native dataset.
The core idea: once radar data has structure, we can finally treat it as a dataset—not just a folder full of files. And once it’s a dataset, it can power science at scale.
References
Saltikoff, E., Friedrich, K., Huuskonen, A., Lengfeld, K., Werner, M., Chandra, M., … & Becker, A. (2019). An Overview of Using Weather Radar for Climatological Studies: Successes, Challenges, and Opportunities. Bulletin of the American Meteorological Society, 100(12), 2253–2270. https://doi.org/10.1175/BAMS-D-18-0166.1
Data Scientist