TensorOps: Scientific Data Doesn't Have to Hurt

Software Engineer
Okay friends, it’s time to take the Data Pain Survey:
- Does it take your team three weeks or more to repurpose an existing dataset for a new data product?
- Do you have team-A and team-B versions of the same dataset?
- Do you miss delivery dates because you cannot estimate the work necessary to serve data across two or more teams?
- Have you ever accidentally overwritten some or all of your customer-facing data product?
- Have your customers ever alerted you to the fact that your data product is missing or incomplete?
- Have you ever accidentally released unvalidated or unclean data to production?
- Have you ever had to declare an outage window to release an iteration of your data product?
- Do you have separate pipelines for ingesting the same data into different formats?
- Do you have periods where two or more of your data products are out of sync with each other?
- Do you have a data product that you are not sure you could reproduce with perfect fidelity?
If your answer to any of the preceding questions was “yes”, then welcome to the club! Your experience is perfectly normal. And this post is for you.
Anti-patterns
We’re a small team here at Earthmover, but we have almost a century of combined experience between us building scientific data pipelines in academia and industry. And in that time, we’ve noticed the same patterns (and anti-patterns) again and again. We’ve become increasingly convinced that these anti-patterns are holding back open and collaborative science, and slowing down the development of crucial and innovative data products.
The past ten years have witnessed a total transformation in the data infrastructure landscape, with the rise of data platforms like Snowflake and Databricks and an ecosystem of tools in their orbit which address many of the problems described in the Data Pain Survey. However, the scientific data community has largely been left behind by this transformation because our data don’t fit neatly into the tabular data model. (See our recent post on Tensors vs. Tables for an deeper dive into this data model mismatch.)
We believe that there are lessons we can learn from the wider data engineering and machine learning communities, lessons that ensure that scientific data and the associated software better enables the following virtues:
- Collaboration, wherein data and code are discoverable, accessible, and inclusive.
- Velocity, wherein code and data are manageable, composable and reusable.
- Reliability, wherein data systems are transactional, auditable, and performant.
Our team’s path to this realization has been a long and public one, informed heavily by our work spearheading the concept and adoption of ARCO data formats and the wider Cloud Native Geo movement, as well as lessons learned from the ambitious Pangeo project. Along the way, we’ve realized that, while important, data formats are only one piece of a puzzle that includes the whole process of working with scientific data, from initial discovery to final delivery.
In a follow-up post, I’ll talk about our vision for the future, as well as outline Earthmover’s commercial and open source roadmaps. But first, I want to spend some time discussing the manner in which I’m sure most — if not all — of us are used to working with scientific data, and all the myriad ways in which it’s a messy drag on innovation and productivity. If you answered “yes” to any of the questions in the Data Pain Survey, then you are in very good company.
About academia vs industry
In this piece, I’ll regularly use the terms “academia” and “industry” interchangeably or conflate the two entirely, which might strike readers as incongruous. But, in our experience, both types of entities use similar workflows, regardless of whether their data products are for research, public utility, or sale. In many cases, data products and processes actually start their lives in academia, graduating with their creators into industry.
The status quo
Let me know if this looks familiar to you:
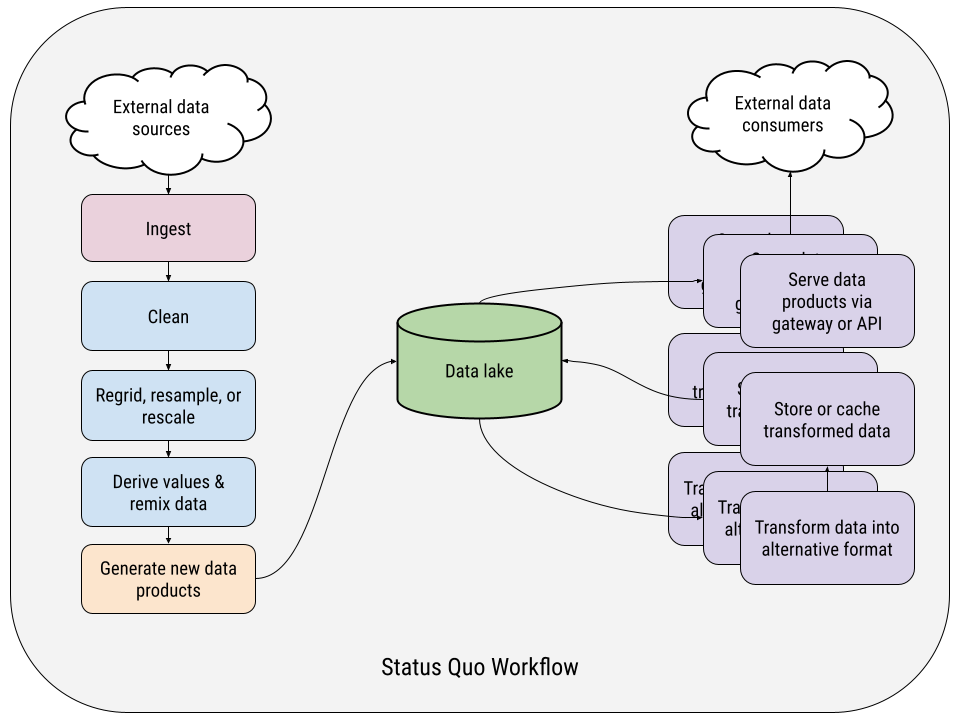
In our experience, this is how even the most mature labs and data teams structure their data pipelines.
On the left-hand side of the chart, you have a single data acquisition/production pipeline, which is downloading data, transforming it, generating some novel data product, and saving that to storage somehow. The order and details of the transformation steps might vary from one pipeline to another, but the overall structure is generally the same. It’s all wired together more or less in series, a big batch job with intermediate data dumps in random, ephemeral locations between steps – typically local to wherever the computation is being performed.
On the right-hand side are the data delivery pipelines – and there are almost always more than one per data product. In these, data must be transformed from the output of the acquisition pipelines – typically from one file format to another – and cached or stored long-term in this new format as a fully materialized copy.
This data might be accessed via a bespoke REST API sitting on top of a pile of Parquet files on object storage. Or it may be formatted NetCDF files served by an OPeNDAP server backed by a networked file server. Or it might be a custom Airflow pipeline generating map tiles for a web mapping visualization. Or, heck, we’ve even seen terabytes of GRIBs or CSVs being regularly pushed to an FTP server, orchestrated by cron jobs and shell scripts.
The point is that each pipeline is a special snowflake, unique to the data product, format, and use case it’s serving.
It might not seem like it, but this architecture – and the way we structure work around scientific data in general – imposes an insidious tax on our ability to scale our teams, diversify our data product offerings, and make improvements to those products over time.
As a result, the status quo is often antithetical to the values above:
- It is obstructive, thanks to data swamps filled with a proliferation of data products in various inaccessible formats.
- It is slow-moving, thanks to product-specific silos of data, code, and human beings.
- It is unreliable, thanks to opaque and fragile pipelines, made using formats and tools often unsuited to building and maintaining operational systems.
So let’s drill into some of the subtle consequences of the status quo architecture and how it’s holding us all back.
Data swamps and duplicate code and gatekeepers
I’m being generous when I call the storage in the middle of the chart above a “data lake”. It’s too often in reality a data swamp – a loosely-confederated, unstructured, unindexed maze of storage solutions and partial datasets that requires tacit knowledge, social connections, and on-the-job experience to navigate and use properly. The documentation is missing or sparse or just straight up wrong. The naming conventions are choose-your-own-adventure. The majority of the datasets in this swamp are aborted experiment output, intermediate processing data, or orphaned and forgotten altogether.
If you’re lucky, your data team or lab has a Jeff or a Susan – the person who serves as the gatekeeper to the datasets everybody uses as the building blocks for their own projects and data products. If you don’t know where something is, everybody will tell you the same thing: “Ask Susan.” Have a question about why this variable has such strange units? “Ask Jeff.” What’s the update cadence? “Ask Susan.”
These gatekeepers serve a crucial role under the structure of the status quo, acting as a de facto catalog and provenance log. These people know where the operational data is, where it came from, how it’s been altered or cleaned, and all the caveats inherent to its production and use.
If you’re not so lucky as to have a Susan or a Jeff, then you work someplace where each team or product owner has their own copies of all the constituent datasets, usually on a file store or (if you work someplace fairly progressive) in one of a dozen unconventionally-named buckets somewhere in the cloud.
Either way, without access to tacit knowledge, it’s impossible to leverage the data in these swamps as shared assets, or to make use of any improvements other teams have made (error correction, downscaling, regridding, derived variables, etc.) And so, too often, each new project spawns its own duplicate copies of each dataset. While this leads to bloat in storage costs, an even more important consequence is the stifling of collaboration and innovation.
What’s less immediately obvious, though, is that pipeline code is also unnecessarily duplicated. Because each stage is operating on the output of the previous stage – and each pipeline evolves in isolation – in practice it is very difficult to reuse code from, say, one dataset’s cleaning phase in another’s. Not least because these pipelines are so rarely structured into clear phases. More often than not, the jobs of cleaning, regridding, and derivation are interleaved throughout a pipeline, creating a tangle of operations that’s unique to both the input and output of a specific pipeline.
Opaque and fragile pipelines
Every dataset in the status quo is the sum of all its pipeline’s constituent steps. The serial nature of this arrangement has serious implications:
- Did you discover a data error introduced upstream that needs cleaning or correction? Regenerate the whole dataset.
- Do you need to tweak the calculation for a derived quantity? Regenerate the whole dataset.
- Do you want to inline a new variable upstream to improve your model? Regenerate the whole dataset.
- Does your customer want a subtly different deliverable? Rewrite the whole pipeline… then regenerate the whole dataset.
In short, every iterative change anywhere within a pipeline incurs the cost of a wholesale re-run. And this means that, once you’ve moved past the prototyping phase, development slows to a crawl as the value of any incremental improvements must be weighed against the cost of re-running the whole pipeline. All that extra compute time. All that extra storage cost. It’s too expensive, in time and resources and — most importantly — opportunity.
So, again, innovation drags and experimentation suffers.
And even when changes are made, there’s no way to tell who made them, what they changed, or when they changed things. We find out that changes upstream broke downstream data hours or days or weeks later, often only after customers have complained. The longer a product or pipeline lives, the more opaque and the less reproducible it becomes, as it accumulates custom cruft from other constituent datasets and pipelines.
A word about reproducibility
A key goal of the open science movement has been the provision of all data and processes necessary to reproduce a study’s results. Partially, this is due to the understanding that broad reproducibility increases the speed and rigor of the scientific process, but it’s also a response to the increasingly collaborative and global nature of science.In industry, there has also been a quiet rise in the importance of reproducibility, driven as much by regulatory and security demands as by increasingly complex and fast-paced model development. Once again, although the applications may differ, both academia and industry have similar requirements from their scientific data workflows.
And if perchance a pipeline goes rogue and fills the forecast with NaNs — or, as is so often the case, updates the metadata and then dies midway through an update, rendering the result dataset unusable — the entire team needs to scramble to find the bug, manually update some metadata, and — you guessed it! — regenerate the whole dataset.
The net effect is always the same to your consumers: Cost, downtime, propagation of errors, and unreliability.
Exclusionary and inaccessible products
As mentioned above, the export pipelines are singularly focused on delivering data to consumers (usually paying customers) in a given format and via a specific method. The specificity of these pipelines — and their lack of shared infrastructure and code — typically means that it’s simply too costly to build out delivery pipelines for non-paying customers.
In the end, this means that your own GIS analysts and spreadsheet mavens and web developers are left out in the cold. Unless a web map is a core product offering, it’s too costly to build a bespoke tiling pipeline. Until there’s a keen and compelling business case for analysts to use your forecast product, you simply can’t spare the resources to spit out GIS layers. Until someone comes knocking on your door with a bag of money, it’s not worth it to build out a time series API for that non-core data product.
And so your analysts and executives and web developers have to either make do without your data products or wrangle together their own Rube Goldberg pipelines to transform your product into something that they can use.
And in the process, they build yet another silo with ever more maintenance debt.
Looking ahead
I feel it’s important to emphasize that the dysfunctional nature of our collective scientific data pipelines and organizations isn’t intentional, nor is it the product of ineptitude. People are doing the best they can with the tools they have, but we can do better. Here at Earthmover, we firmly believe that our community merely suffers from a lack of modern and easy-to-use tools coupled with clear best practices. In fact, that’s the principle we founded the company on.
And we’re laser focused on providing the community with both tools and guidance. It’s why we’ve started writing so much content about why traditional data engineering tooling is entirely unsuited to use with arrays, and why formats like Icechunk are total game changers.
In my next post, I’ll outline the architectures, software, formats, workflows, and roles that make up this thing I’m calling TensorOps. And I hope I’ll also lay out a clear and compelling case for why the adoption of TensorOps will help your scientific data organization collaborate better, iterate faster, and serve data products more reliably and scalably than ever before.
In the end, our goal is that nobody should ever have to answer “yes” to any of the questions in the Data Pain Survey again.
Software Engineer