Cloud-native platforms are the natural evolution of atmosphere-ocean open-data practice

Forward Deployed Engineer
At Earthmover, we are a team of scientists and engineers building a platform for cloud-native scientific data analysis.
Bringing together Icechunk, a cloud-native format that scales like the underlying object store; Flux, a data delivery engine that lets anyone become a data distributor; and Arraylake, a catalog that presents your datasets as a coherent whole; we are building an incredible user experience around multi-dimensional and multi-faceted array data in the cloud. At some level, we are all motivated by painful experiences, full of toil, building infrastructure and research software over the past few years. Personally, over 4 years at NSF NCAR (National Center for Atmospheric Research), I felt that this pain limited the questions we asked, limited the questions we thought to ask, and limited the questions we ended up answering. This painful status quo need not persist.
But there are deeper currents afoot. How did we get to this point? And why are we at Earthmover so excited about the cloud?
Ultimately, we think the commercial cloud allows us to more fully realize a vision, articulated about 20-30 years ago, at a scale that is unparalleled. That bottom-up vision recognized that “most research oceanographers are potential data providers as well as data users”, that “users [should] think in terms of manipulations of data sets rather than manipulations of files”, and that there is a need for “translating to and from a variety of formats and between ‘data cultures’.” (Cornillon et al., 1993, 2009; Hankin, 2010).
This post is an incomplete sketch of how that vision came about, and how, perhaps subconsciously, that vision still influences us today. It is the written version of a 45 minute seminar I delivered at the NSF National Center for Atmospheric Research.
🌬️ How we got here? Meteorology
Open-data practice in ocean/atmosphere sciences is approximately 170 years old! While it is easy to exclaim, “weather/climate are global, of course we must share data”, the actual story is anything but. That story holds valuable inspiration that we can draw from as we face a significant reduction in US climate science research.
The late 1800s
In 1853, Lt. Matthew Fontaine Maury of the US Navy convened a group of representatives from the navies of Belgium, Denmark, France, Great Britain, Netherland, Norway, Portugal, Russia, Sweden, and the United States for the First International Maritime Conference Held for Devising an Uniform System of Meteorological Observations at Sea (Maury, 1853). The group’s goal: the systematic collection and sharing of meteorological observations at sea to compile seasonal wind and ocean current charts for safer marine navigation.
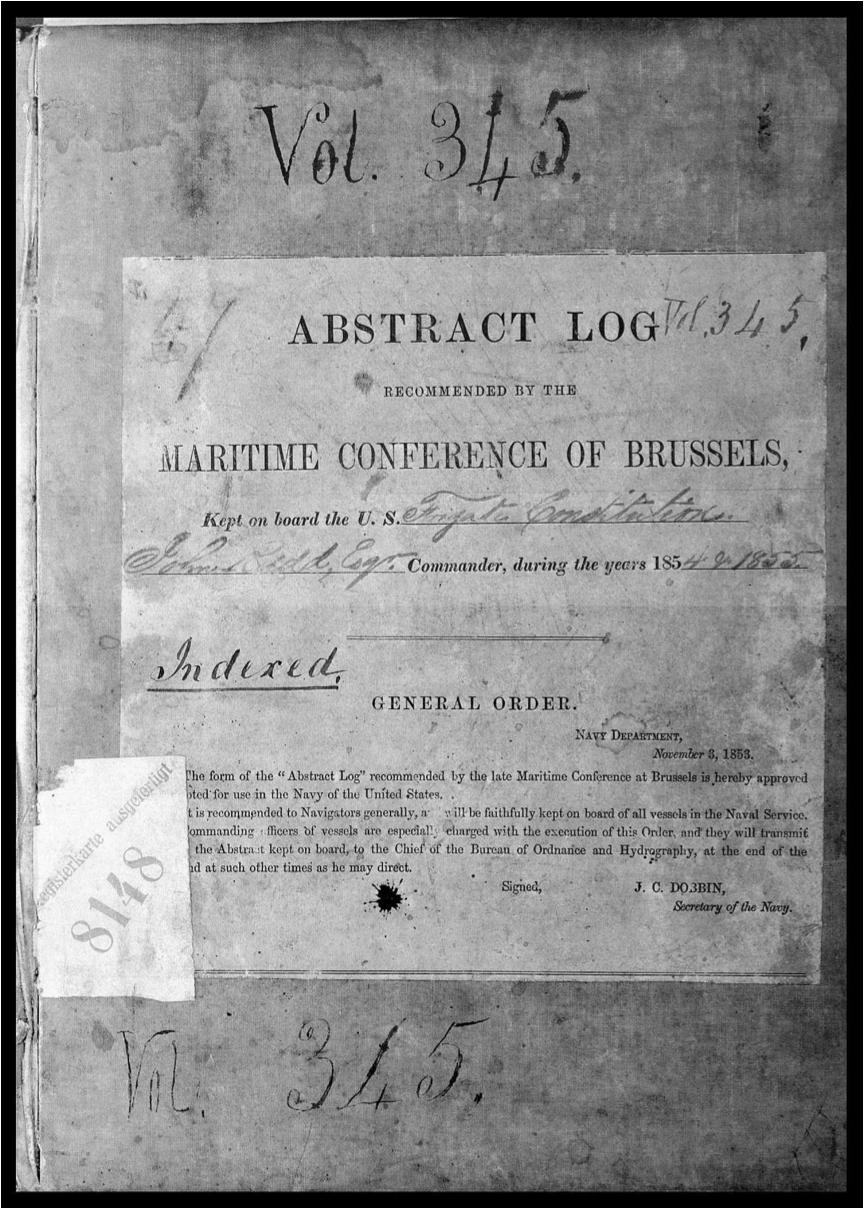
The report of that meeting sets out procedures for the systematic recording of meteorological observations at sea in an “abstract log”, recorded complaints about the quality of the instrumentation of the time (Maury, 1853):
“That an instrument so rude and so abundant in error, as is the marine barometer generally in use, should in this age of invention and improvement be found on board any ship, will doubtless be regarded hereafter with surprise”
recognized the need for global cooperation, even in times of war:
_… procure for these [observations] a consideration which would secure them from damage or loss in time of war, […] and that, as vessels on discovery or scientific research are by consent suffered to pass unmolested in time of war, we may claim for these documents a like exemption, and hope that observers, amidst the excitement of war, and perhaps enemies in other respects, may in this continue their friendly assistance
_
and ends with a stirring call for open and free data exchange:
it is confidently hoped that […], there will always be a full and free interchange of materials [data], and a frequent and friendly intercourse between the departments: for it is evident that much of the success of the plan proposed will depend upon this interchange, …”
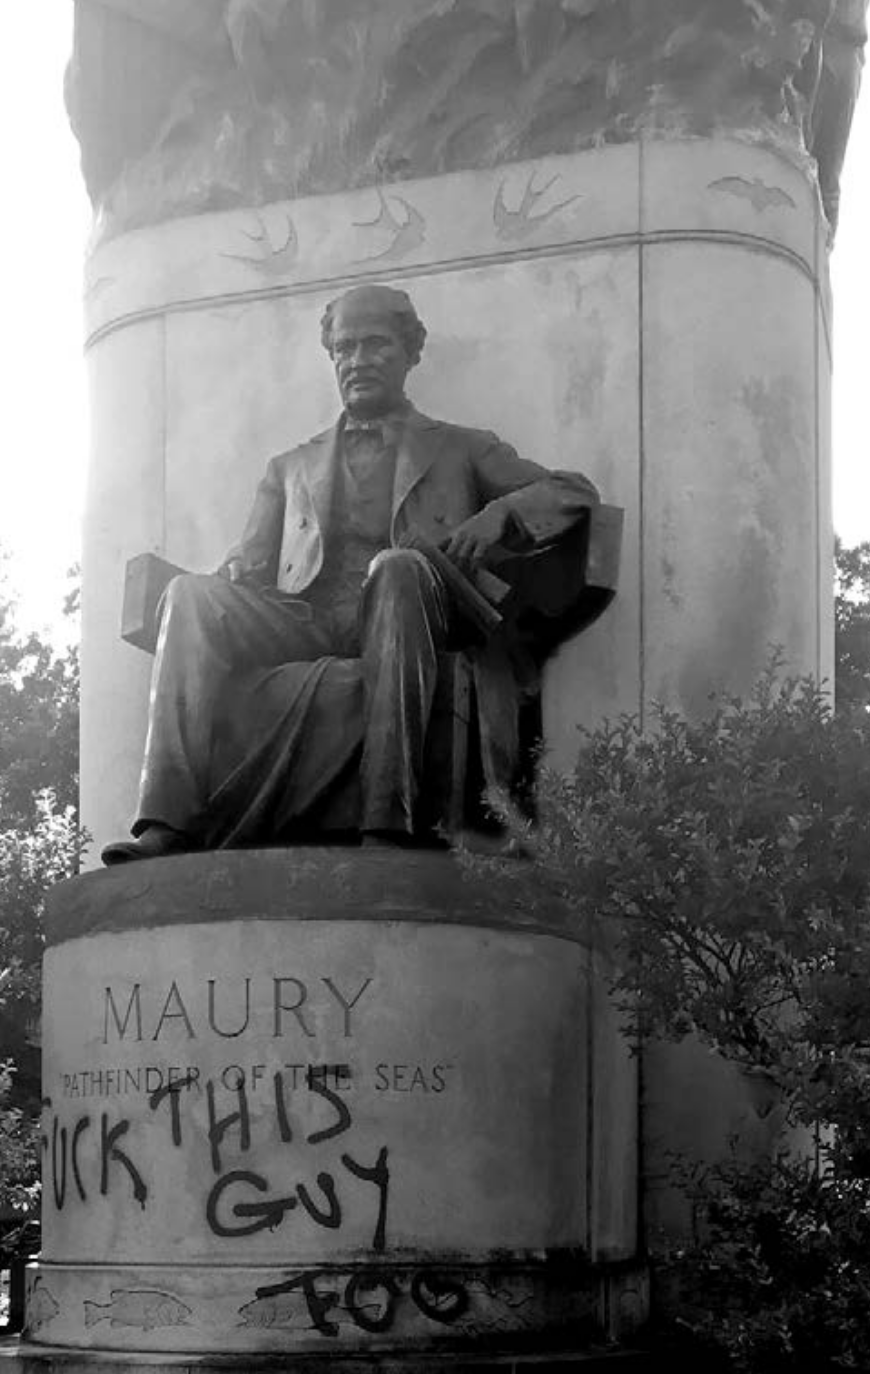
Statue of Lt. Matthew Fontaine Maury in Richmond, Virginia. Image reproduced from (Hardy & Rozwadowski, 2020). Maury made significant contributions to atmosphere/ocean science, was a staunch pro-slavery advocate — he defected to the Confedaracy during the American Civil War, and was a proponent of expanding the American system of slavery to South America

Abstract log of the US Frigate Constitution, 1854-1855. Reproduced from (Braun, 2000).
Maury himself remarked that this experiment in global cooperation and coordination was without equal at that time:
Allow me to add, that we are taking part in a proceeding to which we would vainly seek for a parallel in history. Heretofore, when naval officers of different nations met in such numbers, it was to deliberate at the cannons’ mouths and the most efficacious means of destroying the human species. To-day, on the contrary, we see assembled the delegates of almost every maritime nation, for the noble purpose of serving humanity by seeking to render navigation more and more secure. I think, Gentlemen, we may congratulate ourselves with pride upon the opening of this new era.
The story behind the Brussels conference is not all roses.
Maury initially asked permission to hold a meteorology conference covering both land and ocean, but this landed him in conflict with Joseph Henry of the Smithsonian (Houvenaghal, 1987), who was opposed to the idea of international cooperation. Despite that blemish, Joseph Henry’s, and the Smithsonian’s, involvement in American meteorological data infrastructure is extraordinary. Henry, with his background as a meteorology professor, had a long standing fascination with data collection. In his first year as president, he called for setting up a “system of meteorological observations for solving the problem of American storms”, and eventually set up a volunteer observer network across the US, Latin America, and the Caribbean.
By 1849, Henry had made agreements with a number of telegraph companies to provide the Smithsonian every day with brief weather descriptions. In 1856, he began using the data to display daily conditions on a weather map mounted in the Castle. […] By 1859, the logs of daily observations that the Smithsonian’s weather observers mailed to the Institution every month had created a massive backlog of data. Henry hired Professor James H. Coffin of Lafayette College to reduce the raw data, and Coffin employed “from twelve to fifteen persons, many of them female,” as “computers” to process the data, but they struggled to keep up with the large amount of work.
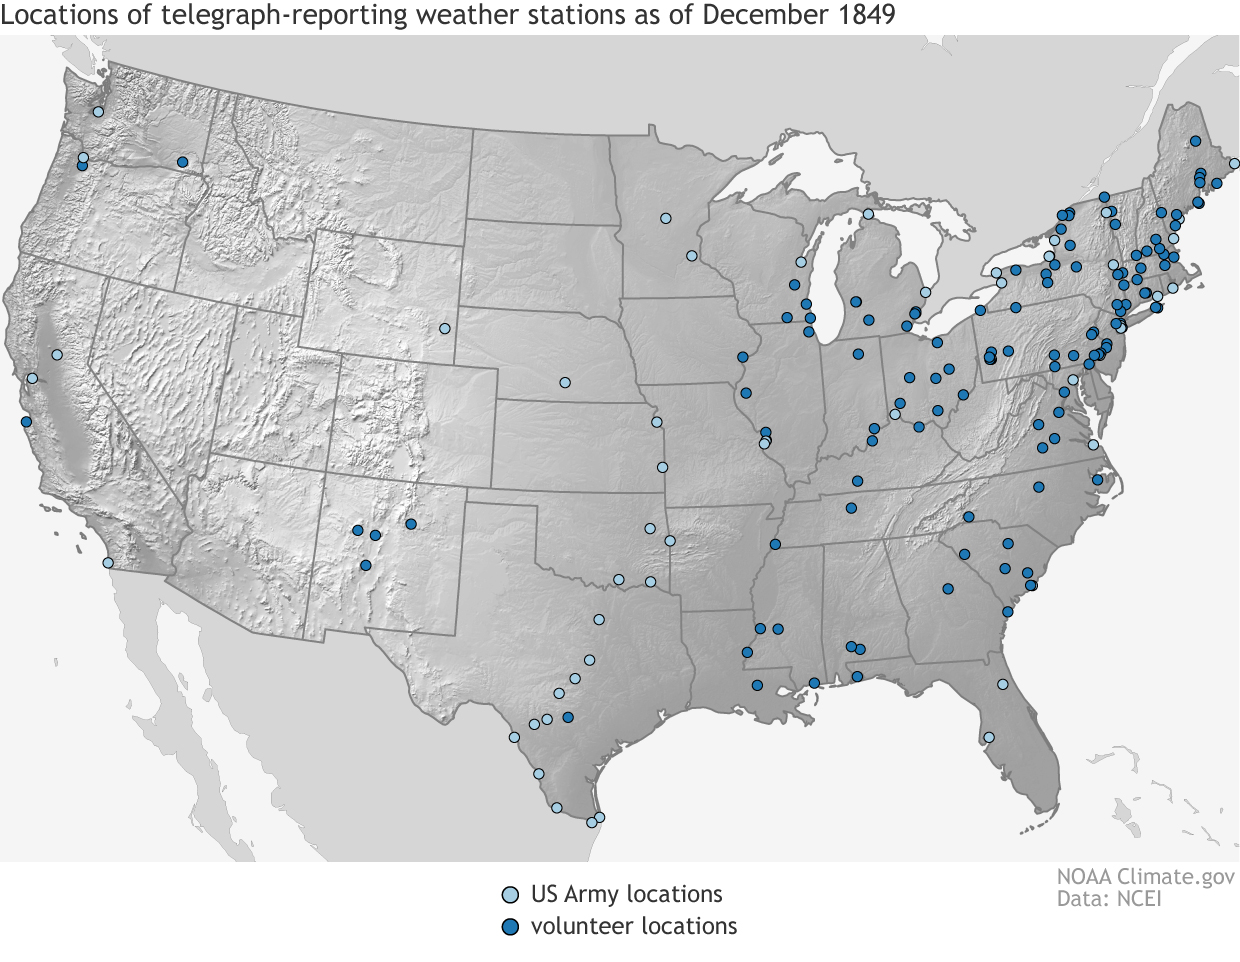
Telegraph data stations as of 1849, courtesy the National Centers for Environmental Information (NCEI; Source).
The Trump administration is proposing a 25% cut ($18 million) to NCEI’s funding.
The early 1900s: Toward the WMO
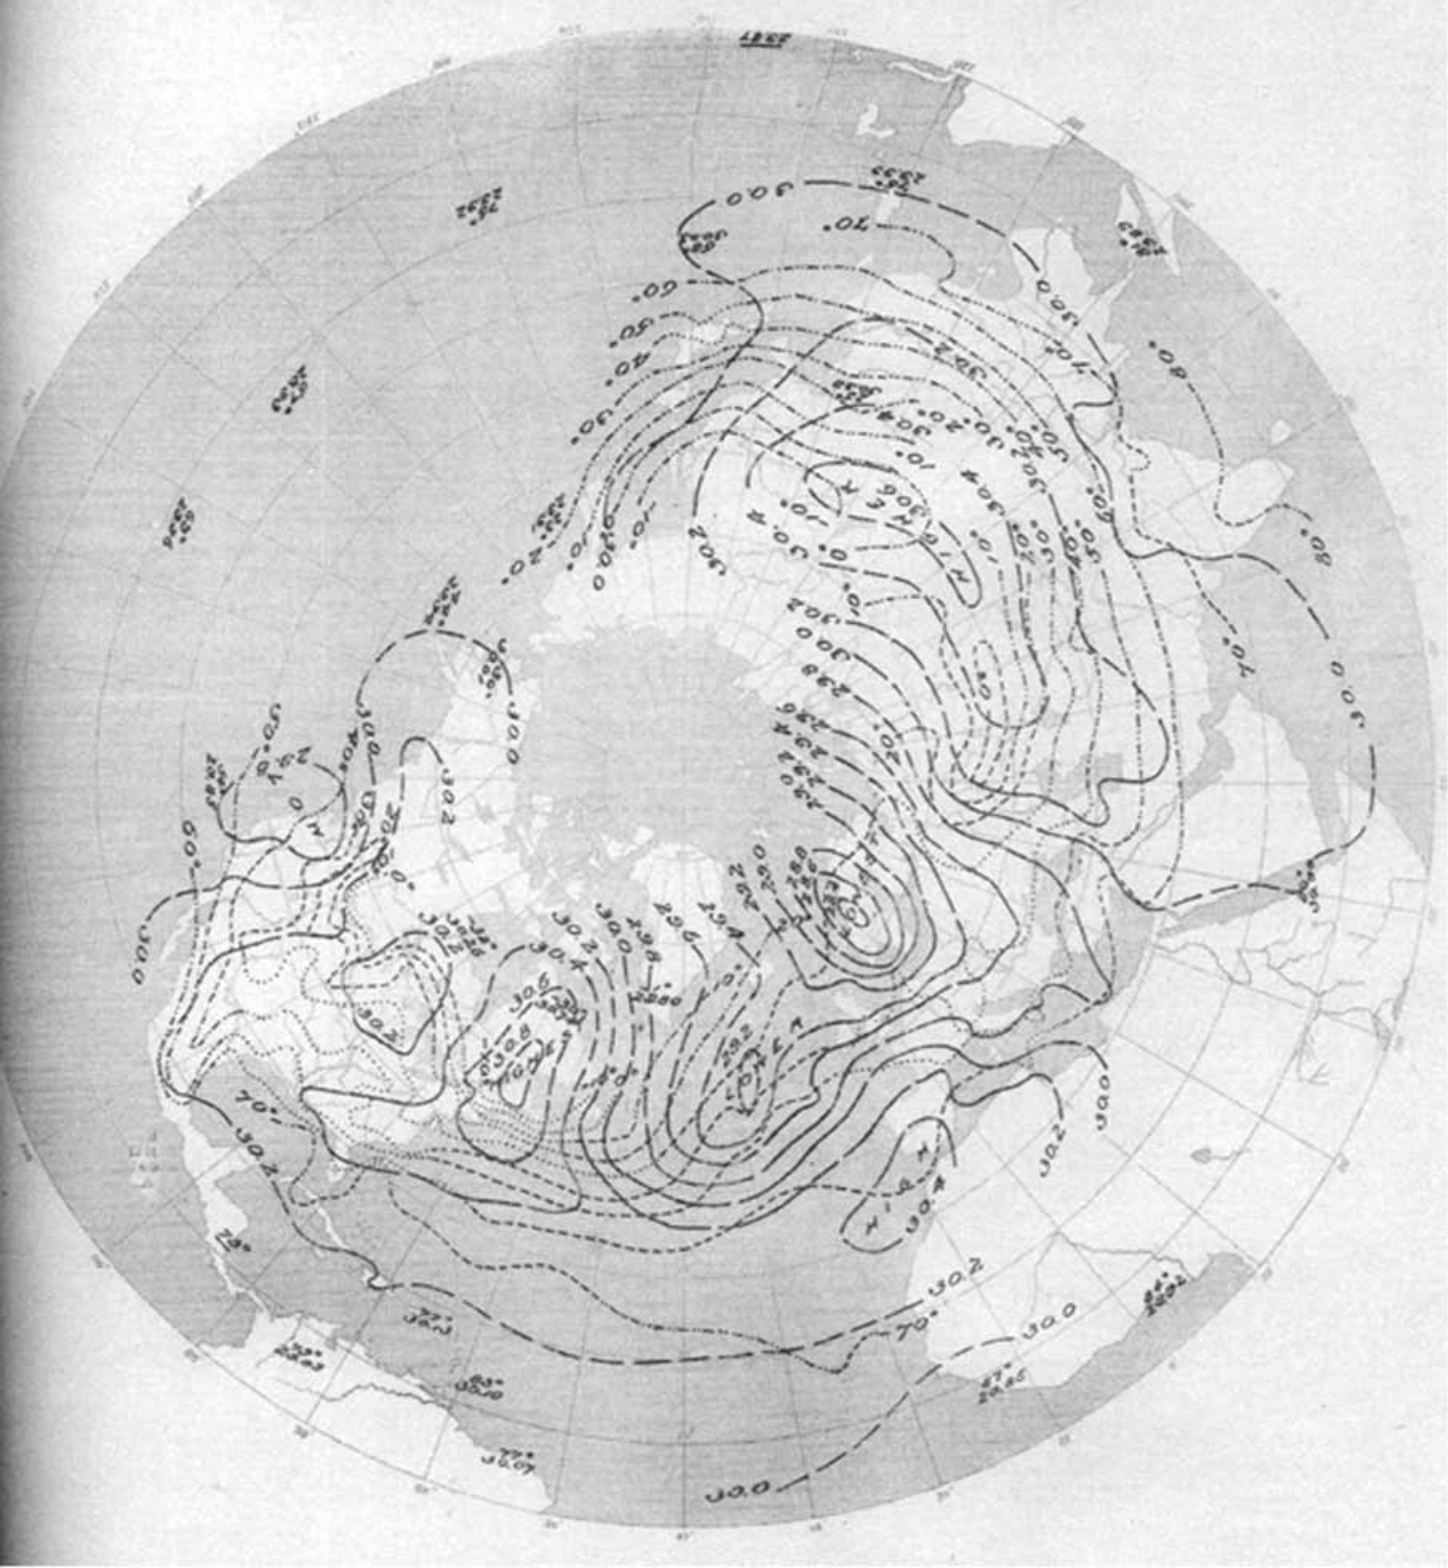
Synoptic chart of the Northern Hemisphere from 28 Jan, 1884, reproduced from (Fleming & Seitchek, 2009). See also a War Department synoptic map of the US from 1872, and a full collection of daily synoptic maps at the NOAA Library.
The Smithsonian’s weather program was eventually transferred to the War Department’s Signal Service, and then to the US Weather Bureau (eventually renamed the National Weather Service, NWS) in 1891. The Cooperative Observer Program (COOP) is still active today though the mode of transmission has shifted from paper forms to the internet. The Signal Corps constructed synoptic charts covering the Northern Hemisphere back in the 1880s
I will skip over the IMO era, and merely remark that data sharing makes it to foundational documents of the World Meteorological Organization (WMO) (WMO, 2023):
Recognizing the importance of an integrated international system for the observation, collection, processing and dissemination of meteorological, hydrological and related data and products,
For one overview of this period of meteorological data sharing, see (Edwards, 2006).
1960-1990: the Cold War & World Weather Watch
NASA Deputy Administrator Hugh L. Dryden, left, and Anatoli A. Blagonravov of the Soviet Academy of Sciences during their March 1962 meeting (Source).
The Dryden-Blagonravov memorandum of March 1962, 6 months before the Cuban Missile Crisis, facilitated US/USSR cooperation in “exchange of weather data from satellites and the eventual coordinated launching of meteorological satellites” (source). Soon after this, urged by the WMO, the US and Soviet Union agreed to share weather information in 1964. From President Lyndon Johnson’s statement at the time:
“The United States and the Soviet Union have been working out an agreement to exchange weather information over a direct communications link between the two capitals. […] provides for the exchange on a reciprocal basis of weather information gathered by satellites.”
This sets the impetus for the World Weather Watch wherein all
“WMO Member States and Territories collaborat[e] to collectively operate a global observing system (GOS), exchange the global observing system data through a global telecommunications system (GTS), and build an integrated network of world, regional and national meteorological centres as part of a global data-processing system (GDPS).”
This global effort, one among many, yields the “quiet revolution” in weather forecasting that we all depend on today (Bauer et al., 2015). Importantly, the GTS is still in operation today as a private network interconnecting the national meteorological services across the globe and is expected to be phased out in favour of the public Internet by 2033!
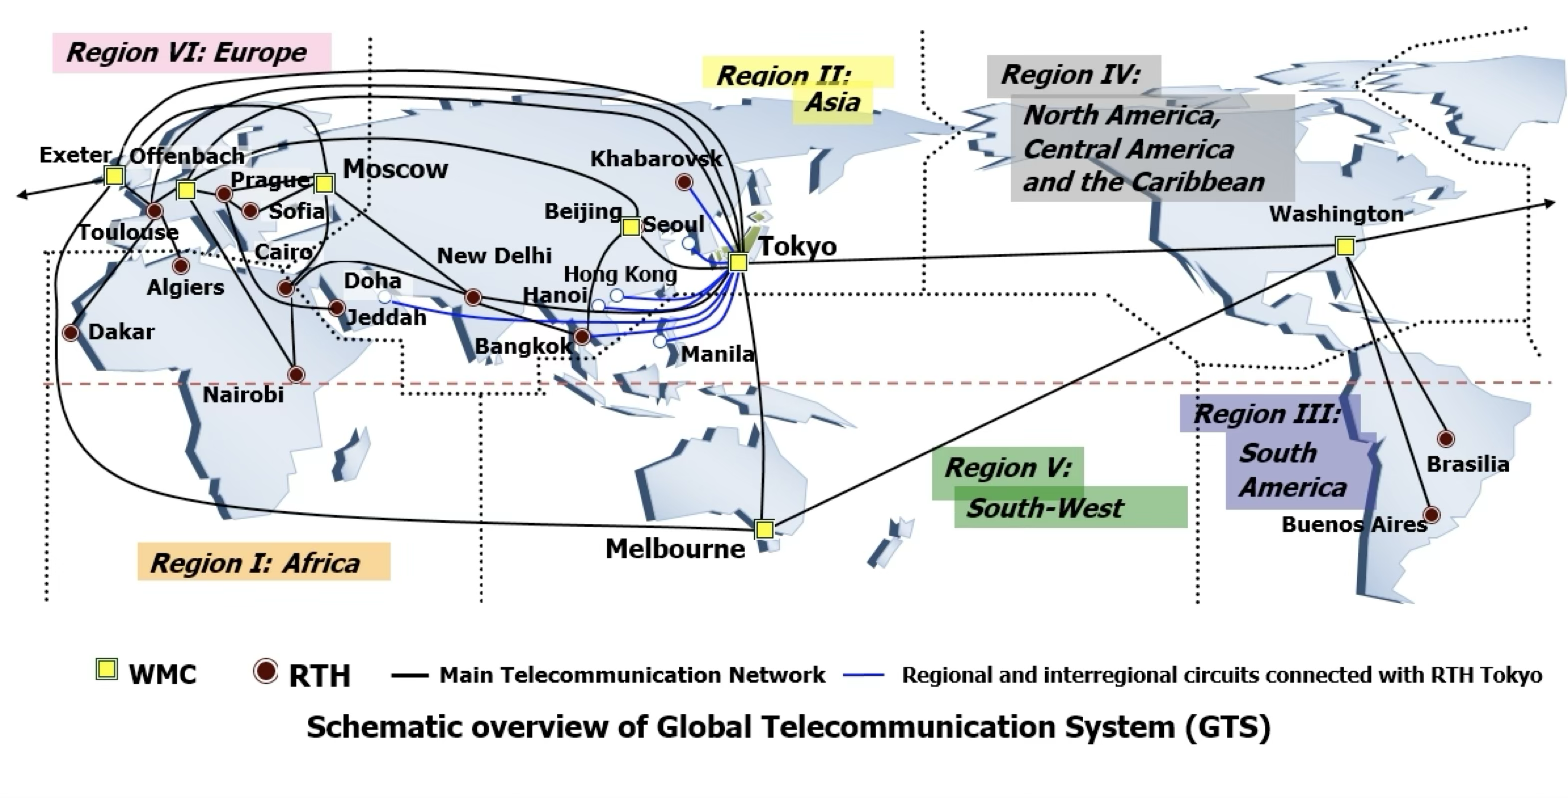
Schematic of WMO’s GTS network (source).
1990-2000: The drama behind WMO Resolution 40 unfolds
I quote liberally from this official WMO report on Resolution 40 (Zillman, 2019) in this section.
WMO constituent bodies have adopted thousands of resolutions since 1950 but only one, […], has needed no other identifier and continues to be known throughout the WMO system simply as “Resolution 40”
The privatization head winds of the late 1980s, driven by the election of Ronald Reagan (US) and Margaret Thatcher (UK) hit the “golden age of meteorological data sharing”. The pressure to commercialize operations and recover costs posed a major challenge to the data sharing ethos of the time. To quote Neil Gordon, New Zealand’s representative to WMO during this period (Morris, 2023)
“What was happening was observations from, say, France were going on international circuits into the United States to be used and ingested into weather models.… [Those data] would then go to companies like AccuWeather, who would then provide services back into France. And France was very unhappy about it. There was a risk that they would no longer send their data to the States.” >
“We almost got to the point where data exchange was being shut off,” Gordon recalled. The lead up to the Twelfth WMO Congress in 1995 was charged with the “likelihood of an imminent global meteorological “data war”” looming (Zillman, 2019)

🎬Mad METAR: BUFR Road, the dystopian “global meteorological data war” Mad Max spinoff you didn’t know you wanted.
A draft resolution was hammered out offline and brought up for adoption. What follows is dramatic!
the atmosphere in the room was electric. Following a few brief general remarks from conciliatory delegations, the President invited specific comment and waited tens of seconds for indication of countries wishing to speak. Delegations all looked around to see who would intervene to shatter the fragile consensus. No national flags were raised but, as the President brought down the gavel to declare the resolution adopted and the Pink approved, New Zealand asked for the floor. The room, though, had already erupted in standing ovation with emotional applause continuing for almost a minute. When the applause subsided and the President invited New Zealand, represented by Dr Neil Gordon, to speak, delegations gulped in apprehension at the prospect of collapse of the near euphoria of moments earlier. Instead of raising issues with the document, however, Dr Gordon embarked on a memorably whimsical set of awards of bottles of New Zealand wine to several of the earlier protagonists in the debate!
🍷Ultimately, Resolution 40 passed, to thunderous applause 👏. “It was one of those times,” recalled Zillman, “when grown men and women almost became like children, they were so relieved.” (Morris, 2023).
In essence, WMO’s Resolution 40 codified a hard compromise. It defined two tiers of data: “essential data and products” that must be provided on a free and unrestricted basis, and “additional data and products” that may be subject to conditions for commercial use; and free access to all data for research and education communities. This story then continues, leading to the Geneva Declaration of 2019 and the ongoing migration of the GTS to use the internet, but here we take leave and look oceanward.
Summary
Thus far, the tale of meteorological data sharing is dramatic. This is top-down infrastructure — a private network built at the nation-state level and designed for National Meteorological Services. As we face another assault on public services, I take comfort in the fact that we, as a community, have weathered the private sector storm once before. It was not easy, but it needs to be done again. I also see the drama as a measure of how important Earth system data infrastructure is: we figured out how to share data before the Internet! These networks are the oldest examples of planetary scale information infrastructure (Edwards, 2006), and we must not lose them.
🌊 How we got here? Oceanography
The oceanographers, meanwhile, start doing something completely different 🙂. The Internet has arrived and holds great promise! In 1993, a group led by Peter Cornillon, Glenn Flierl, James Gallagher, and George Milkowski, meet to discuss DODS: the “Distributed Oceanographic Data System” (Cornillon et al., 1993). Lamenting that “the data systems being envisioned at the time were being designed for access to data from large federal archives”, and that these designs overlooked the point that “most research oceanographers are potential data providers as well as data users”, the group met “to design and implement a data access protocol that would work equally well for the principal investigator as for federal archives” (Cornillon et al., 1993):
“considerable emphasis was placed on maintaining a research oceanographer’s perspective as the focus during the vision’s development. There was a simple reason for this; the purpose of the workshop was to develop a system that will be used!”
Three of the guiding principles for this system were (Cornillon et al., 2009):
- isolate the file format in which the data were stored from the data user
- allow data users to access the data directly from their application packages
- allow data users to acquire only those data of interest (i.e., request data subsets)
![]()
Out of this workshop arose the netCDF/CF/OpenDAP trio (Hankin, 2010).
- The Climate and Forecast Conventions (CF) provide a discipline-specific semantic layer that is independent of the data format.
- The Network Common Data Format (netCDF), developed by National Science Foundation’s Unidata program, is “self-describing” and allows the embedding of arbitrary metadata (e.g. CF conventions).
- Finally, “the data access protocol was conceived as a discipline-neutral layer that would lie above the network transport protocol”, this became OPeNDAP.
- At the same time, the Unidata THREDDS (Thematic Realtime Environmental Distributed Data Services) Data Server (TDS) pioneers the “virtual data cube” - users could now interact with aggregated views of large multi-file archives that may be backed by varied data formats (e.g. netCDF, HDF5, GRIB, and more).
Nearly all NSF Unidata Program Center staff were furloughed between Friday, May 9 2025 and June 2, 2025 due to a funding freeze instituted by the National Science Foundation. The NSF is facing an approximately 50% cut in funding with “climate” being a named target (see Discretionary Budget Request for FY2026 , page 40).
And there’s more! Several projects experimented with server-side compute including visualization through the Live Access Server (LAS) from NOAA’s Pacific Marine Environmental Library (PMEL), Ingrid from the International Research Institute for Climate and Society and Columbia University’s Lamont Dohery Earth Observatory (IRI/LDEO) Data Library, and the GrADS (Grid Analysis and Display System) Data Server developed at the George Mason University’s Center for Ocean-Land-Atmosphere Studies.
PMEL is a lab within NOAA’s Ocean and Atmosphere Research (OAR) Line Office and the Trump administration is proposing to completely eliminate both, with some programs transferred to the remaining Line Offices.
Ingrid is noteworthy in particular for (Cornillon et al., 2009)
“hiding an extraordinary amount of technical detail from the user, letting the user think in terms of manipulations of data sets rather than manipulations of files of numbers. Among other things, this hidden technical detail could be accessing data on servers in other places, doing only the small needed portion of an enormous calculation, or translating to and from a variety of formats and between ‘data cultures’.
Summary
The bottom-up vision pioneered by the DODS effort is powerful, incredibly successful, and draws sharp contrast with the top-down implementation of the WMO system (Hankin, 2010). It recognized the r_esearch oceanographer_ as the central persona to design for, as expected for a system designed by practicing researchers. This focus is evident in many aspects — the development of the aggregated datasets or ‘data cubes’ abstraction, the relative openness of the CF metadata standard, and in the recognition of the need to translate between different ‘data cultures’ through protocols.
These general principles are still relevant today!
❓How well has this worked for us?
But have we fully exploited the potential of the DODS bottom-up vision here?
I say not.
Instead friction abounds.
- The download model still reigns supreme. Most data is distributed in individual files, and analyzed after download. At best one might use subsetting against an OPeNDAP or THREDDS server. As far as I know, large swaths of the community (including me) are unaware of server-side compute services like LAS, GrADS etc.
- Large data archives are navigated and presented in a relatively primitive form (e.g. files and folders);
- Perhaps most importantly, sophisticated services are for privileged datasets at privileged data centers (e.g. the IRI Climate data library).
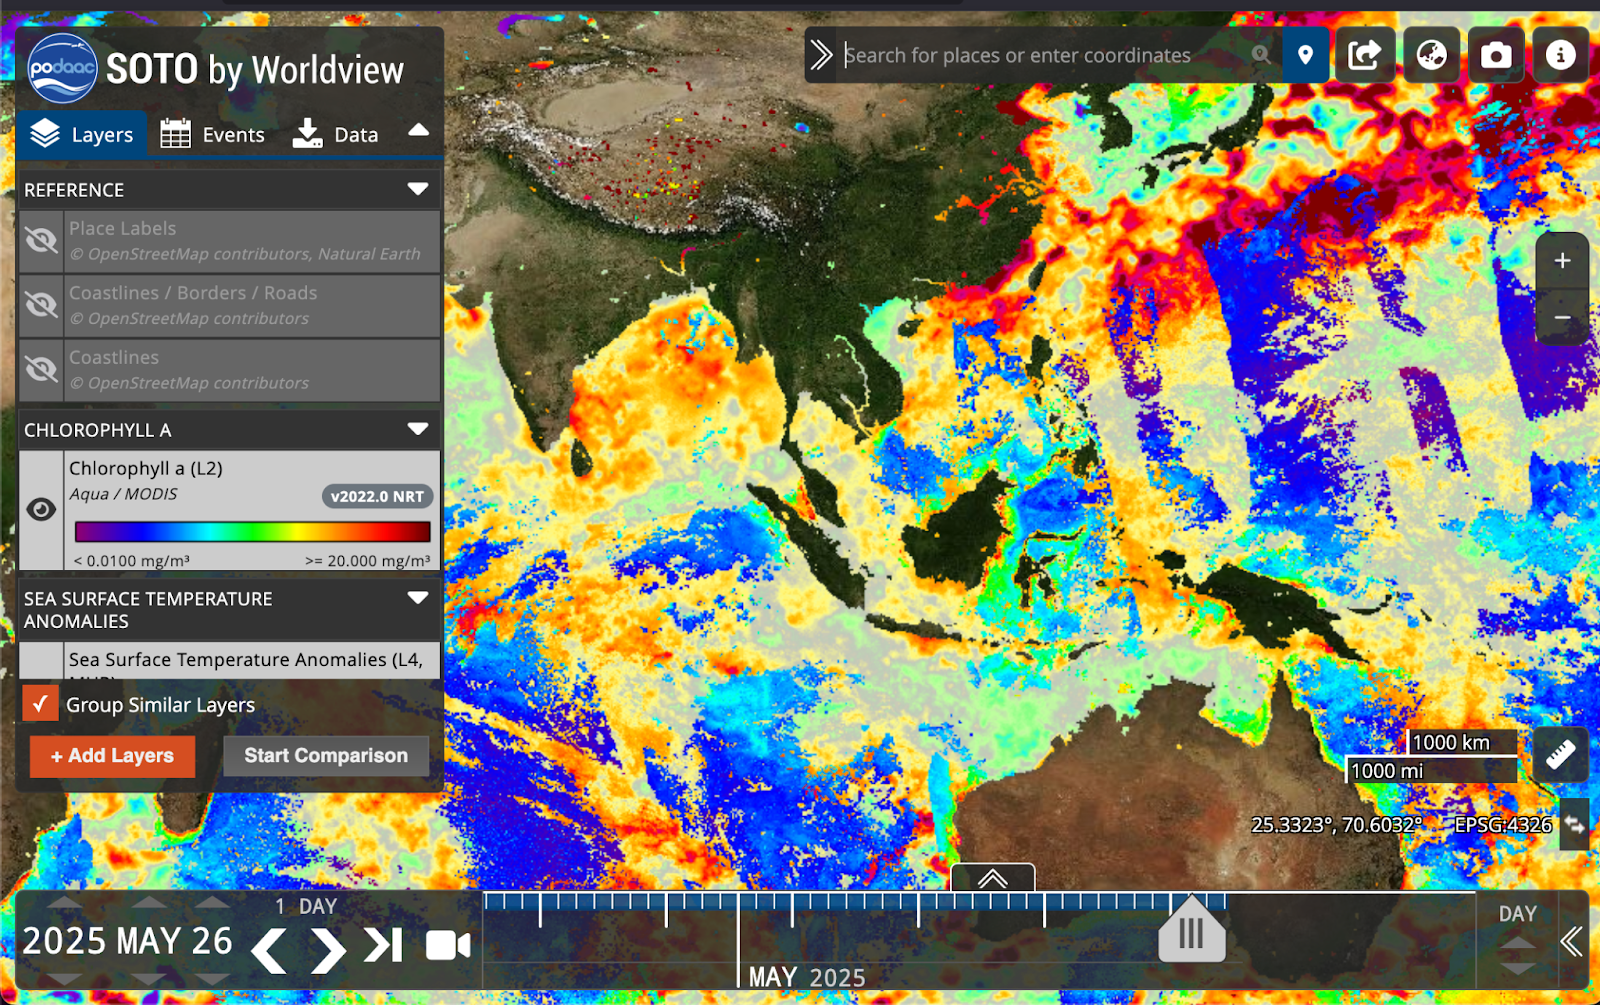
My favorite example of point (3) is NASA PO.DAAC’s State of the Ocean (SOTO) tool. SOTO is amazingly powerful, allowing the user to overlay multiple datasets and time-travel through slices (see slider at bottom) in a fast responsive UI. This image shows an estimate of Chlorophyll-a overlaid over Sea Surface Temperature anomalies. Views are exportable using a URL. It is an incredibly powerful tool for a researcher, and yet only a subset of possible ocean science datasets are available (through no fault of the incredible team that maintains SOTO).
This status quo must change, and I see cloud platforms as a game-changer. To illustrate why, I turn to David Donoho’s exposition of the idea of “Frictionless Reproducibility”.
👐 Why should the status quo change? Frictionless Reproducibility
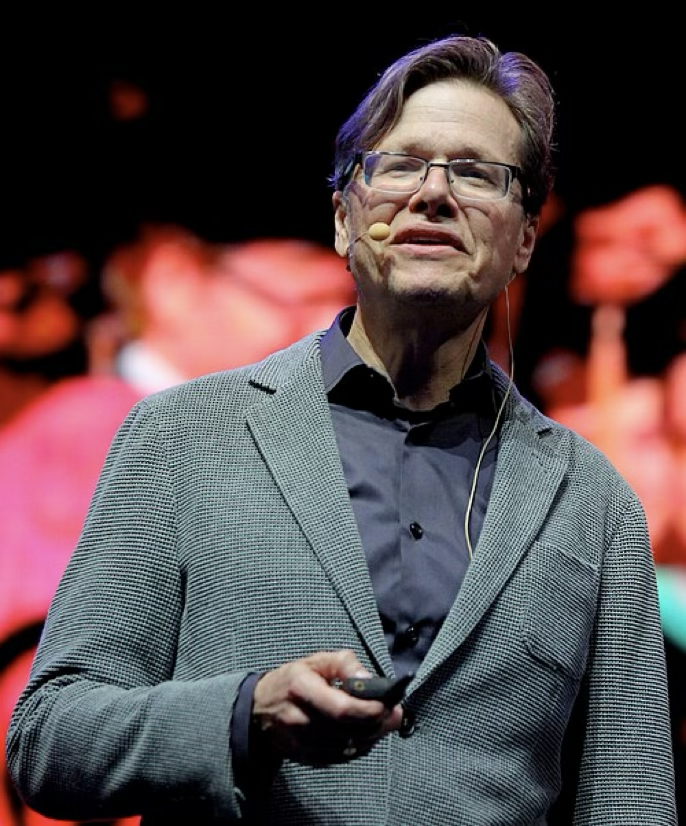
Prof. David Donoho of Stanford University.
(Donoho, 2024) presents an interesting thesis for the rapid rate of progress in Empirical Machine Learning (EML). He argues that this success is predicated on the maturation of 3 fundamental data science principles, and that EML distinguishes itself as a field in its rapid adoption of these principles.
The three principles:
- Data: Datafication of everything, with a culture of research data sharing.
- Re-execution: Research code sharing including the ability to exactly re-execute the same complete workflow by different researchers.
- Challenges: Adopting challenge problems as a new paradigm powering methodological research. The paradigm includes: a shared public dataset, a prescribed and quantified task performance metric, a set of enrolled competitors seeking to outperform each other on the task, and a public leaderboard.
But what stands out to me is the vivid emphasis on these ideas being expressed as frictionless services.
In the past decade, all of these initiatives, in their best implementations, became frictionless open services, essentially offering immediate, permissionless, complete access to each relevant digital artifact, programmatically from a single line of code. Not all friction is yet gone, but the trend is clear: what frictions still remain will vanish soon enough.
As examples, Donoho lists out both commercial and non-profit services
Now, if you squint, you might argue that the ocean/atmosphere research community have practiced some version of these three principles for quite a while. We have data repositories, and a culture of data sharing, built around standard formats and metadata. We may not have full re-execution, but definitely have code sharing in some form particularly when it comes to modelling systems.Finally, one might consider the various Model Intercomparison Projects (MIPs) as community challenges that drive improvements and innovations.
But none of this is frictionless.
Or is somewhat frictionless only if you have access to privileged computing systems: for example, running the Community Earth System Model (CESM) on the NSF NCAR Wyoming Supercomputing Center cluster.
NSF NCAR (National Center for Atmospheric Research) is almost certainly affected by the Trump administration’s proposal to reduce NSF funding by approximately 50% with “climate” being a named target (see Discretionary Budget Request for FY2026, page 40).
Example 1: Frictionless reproducibility in the AI weather prediction space
The increasing occurrence of extreme events is also driving private sector interest in the atmosphere/ocean datasets; as consumers, refiners, and distributors.
I’ll focus on only one example: the “loud” revolution2 in AI weather prediction that clearly follows from the adoption of frictionless reproducibility principles (e.g. Google, Pangu, nVIDIA, and others). Thanks to efforts by many government agencies, petabytes of public data are now available on the commercial cloud. The real-time availability of forecasts from NOAA’s Global Forecast System (GFS), Global Ensemble Forecast System (GEFS), and High Resolution Rapid Refresh (HRRR) systems; ECMWF’s ERA5 Reanalysis and other datasets on the public cloud has catalyzed a revolution in AI weather forecasting, despite the data being provided in sub-optimal legacy formats (GRIB or netCDF).
These datasets are so valuable that many companies maintain private cloud-optimized versions (for more on how our customers use NOAA data see this blog post). Some are public: for example, Google’s Weatherbench2’s Zarr copy of the ERA5 dataset. More recently, Brightband is building a cloud-optimized version of the NOAA NASA Joint Archive of Observations for Earth System Reanalysis (NNJA) currently available in legacy transmission formats in AWS S3.
Note however, the toil involved in converting these datasets from legacy formats to cloud-optimized formats such as Zarr. In many cases, this effort is duplicated across companies and academic research labs for no good reason. Re-execution is possible: see ai-models-for-all courtesy Daniel Rothenberg and ECMWF’s ai-models. Challenge suites are also emerging: Google’s WeatherBench, Brightband’s Extreme WeatherBench, Jua.AI’s Stationbench.
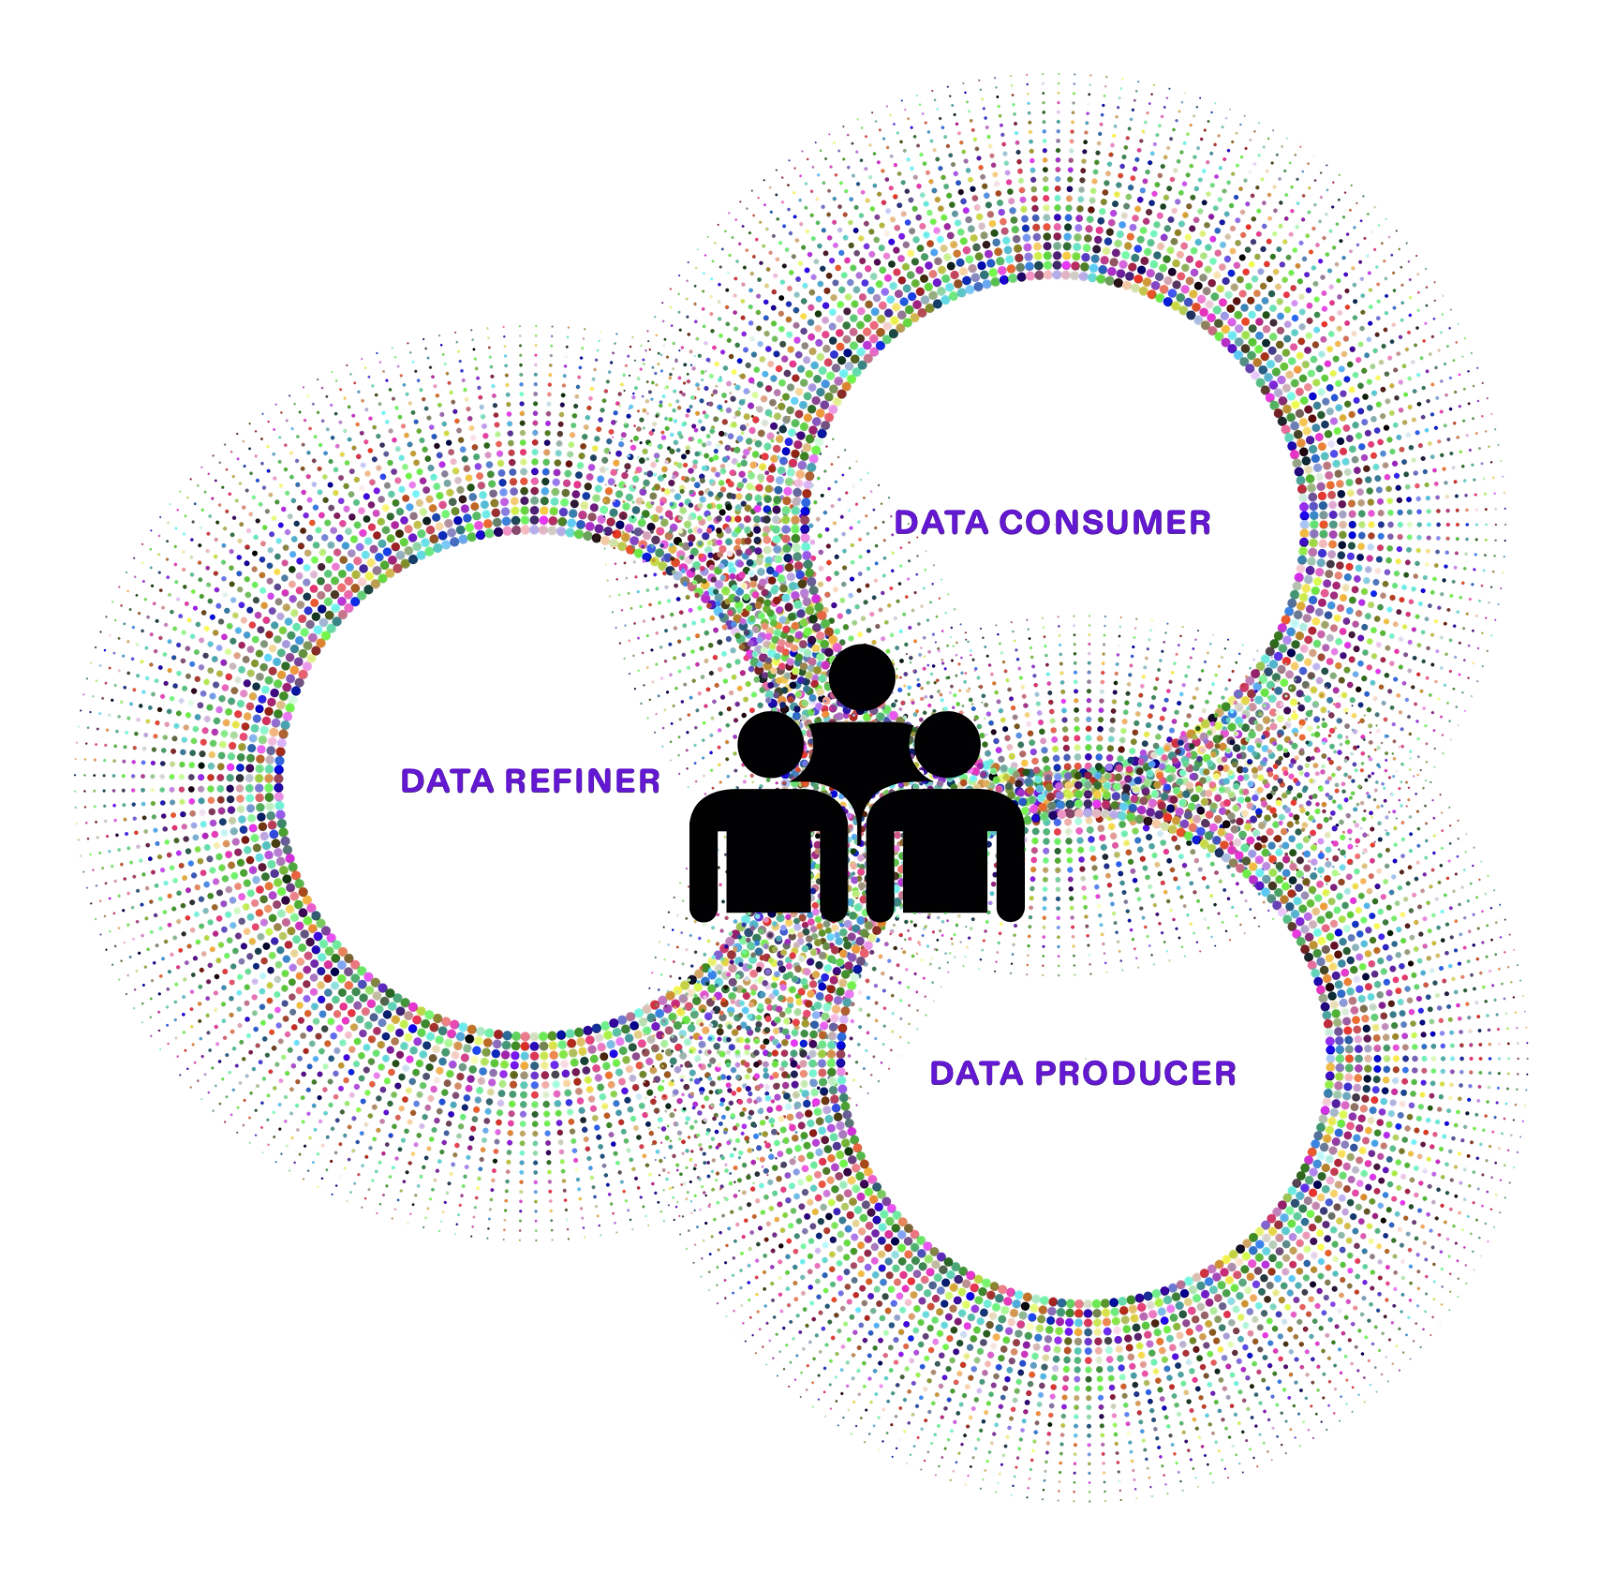
Thus the proposition that “data consumers are frequently data producers” has never rung truer. What has changed is that the target persona must expand from the “research oceanographer” of the 1990s to encompass the data analysts of all stripes in the 2020s.
Example 2: Frictionless reproducibility in the climate research space
Frictionless reproducibility patterns are slowly but surely appearing in atmosphere/ocean science research practice. A few examples:
- ClimateNet (Prabhat et al., 2021), an “expert-labeled open dataset for enabling high-precision analyses of extreme weather”, is distributed as a pile of NetCDF files along with model weights.
- The only long-term archive of the German DWD Forecast Model output is at HuggingFace 🤗, maintained by an external non-profit OpenClimateFix, and the recommended mode of access is to download individual zipped Zarr datasets for each forecast.
- Samudra, an AI ocean physics emulator, distributes weights and the training data through HuggingFace 🤗.
Users are sadly not isolated from the data format anymore; subsetting and data-proximate computing are sadly out of the question. To be clear, I am not criticizing these efforts. They are laudably open. They also clearly illustrate how the bottom-up “every consumer is a distributor” vision still applies in the cloud era, but the technology to realize that vision (netCDF/CF/OPeNDAP) has not been democratized enough.
☁️ How should the status quo change? Cloud platforms.
Despite decades of pioneering open-data practice, I contend we are yet to fully adapt to the 2020s — a decade characterized by
- increased openness and sharing (“frictionless reproducibility”);
- increased participation in software building (“open-source science”);
- increasing private sector participation, who face the same consumption/distribution problems ; and
- increasing need for public-facing research communication.
How do we take full advantage of the open-source/open-science/“frictionless reproducibility” paradigm shift? To me, Donoho (2024) presents “platforms” as the answer.
The COVID-era has shown us that platforms can be powerful accelerants for science. Seemingly overnight, we switched to interacting remotely and effectively on multiple platforms/services: Zoom, Google Docs, Github, Slack, Overleaf (even LaTeX has a cloud platform!); and even JupyterHubs that started popping up everywhere in many different contexts.

Platforms are powerful because (1) they define shared patterns of interaction and (2) have near-zero marginal cost, allowing incredible democratization of technology.
For example, Github has catalyzed growth of open source communities by defining a common paradigm: once you figure out how to contribute to one Github project, you know how to contribute to any of them. At some level, the academic community has realized this too. For example, the US National Science Foundation has funded the supercomputing facility at NCAR since 1963. Such facilities co-locate storage, compute, computational infrastructure (e.g. modeling systems) and important community datasets in a single place. This co-location has been revolutionary to the community in no small part due to access (at last in their recent incarnations) being remarkably open (I wrote my thesis using ~200k core hours on Yellowstone, the system of that time):
“In general, any U.S.-based researcher with an NSF award in the Earth system sciences or related to Earth system science is eligible to apply for a University allocation. We also offer some opportunities for graduate students, postdocs, and faculty who do not have NSF awards.”
NSF NCAR (National Center for Atmospheric Research) is almost certainly affected by the Trump administration’s proposal to reduce NSF funding by approximately 50% with “climate” being a named target (see Discretionary Budget Request for FY2026, page 40).
The commercial cloud offers us the opportunity to take that openness and scale it up, across the academic/non-profit/for-profit sectors. It allows us to build a collaborative space designed around an updated persona: “the analyst” who will assume different roles (consumer/refiner/producer) at different points in time. And importantly, with the cloud’s horizontal scaling and near-zero marginal costs, we get to deploy sophisticated services on any dataset.
✨ A cloud platform for scientific data
![]()
This is exactly what we are working to enable with the Earthmover platform.
- Icechunk, as the underlying format, scales like the underlying object store, natively understands virtual aggregated data cubes, and brings in well-developed concepts from the database world, like ACID transactions and data version control.
- Flux is our data delivery engine, allows users to translate between different data cultures through discipline-specific protocols, recognizing that most data consumers eventually become data providers.
- Finally, Arraylake, our catalog, presents the data as cubes, not files and folders. It exposes the available rich metadata as well as the collaborative history around that dataset.
Here is an example of putting it all together — a crude replica of “State of the Ocean” in Terria.io powered by Flux’s WMS (Web Mapping Service) — for a small subset of a regional eastern Tropical Pacific ocean simulation described by (Cherian et al, 2021). Sophisticated services are not only for privileged datasets any more!
This research was funded by the Climate Variability and Predictability Program in the Ocean and Atmosphere Research Line Office. The latter is completely eliminated in the Trump administration proposal.
Another example is the University of Wisconsin-Madison ALIVE (Advanced Baseline Imager Live Imaging of Vegetated Ecosystems) project (blog). This team uses geostationary satellite data (GOES-R, operated by NASA and NOAA) to estimate terrestrial carbon and water fluctuations in near real-time. They generate near real-time inferences using GOES-R ABI Level 2 products, stored in commercial cloud buckets (Google Cloud, AWS S3, Azure) and made freely available to the public through the NOAA Open Data Dissemination (NODD) program. These data are processed on Google Cloud VMs using Coiled, and the estimates written to Zarr in Arraylake where it can be made available for collaboration and distribution (Losos et al, 2025).
This is cloud-native science, backed by platforms.
🔄 Everything old is now cloud-native
As a community we’ve built up over a century of open-data practice. We have articulated some very fundamental ideas more than twenty years ago now:
- “most research oceanographers are potential data providers as well as data users;” (Cornillon et al., 1993).
- “provid[ing] an aggregated view of large, multi-file archives” and “letting the user think in terms of manipulations of data sets rather than manipulations of files of numbers.” (Cornillon et al., 2009)
- the need to “translate between ‘data cultures’” (Blumenthal et al., 2014)
and implemented them for the Internet age.
But we have not fully realized the possibilities enabled by those ideas. To that end, I find Donoho’s argument absolutely compelling: cloud platforms can be revolutionary, particularly in how they can dramatically expand access to sophisticated ideas and services. At Earthmover, we are doing exactly that with Icechunk, Flux, and Arraylake. And this is why I do what I do at Earthmover.
🙏 Acknowledgements
I acknowledge many discussions over the years with our CEO Ryan Abernathey, CTO Joe Hamman, Rich Signell (Open Science Computing), Matt Long ([C]Worthy), Kevin Paul (NVIDIA), Ethan Davis (Unidata), Ed Armstrong (NASA PO.DAAC), and Jinbo Wang (TAMU).
🦶🏾Footnotes
📋 References
Bauer, P., Thorpe, A., & Brunet, G. (2015). The quiet revolution of numerical weather prediction. Nature, 525 (7567), 47–55. https://doi.org/10.1038/nature14956
Blumenthal, M., Bell, M., Del Corral, J., Cousin, R., & Khomyakov, I. (2014). IRI Data Library: Enhancing accessibility of climate knowledge. Earth Perspectives, 1 (1), 19. https://doi.org/10.1186/2194-6434-1-19
Braun, D. S. (2000). Scientific vision, a passion for observation, and the impetus for change. Earth System Monitor, 4–7. https://icoads.noaa.gov/ESM_SEP2000vol11no1_ed.pdf
Cherian, D. A., Whitt, D. B., Holmes, R. M., Lien, R.-C., Bachman, S. D., & Large, W. G. (2021). Off-Equatorial Deep-Cycle Turbulence Forced by Tropical Instability Waves in the Equatorial Pacific. Journal of Physical Oceanography, 51 (5), 1575–1593. https://doi.org/10.1175/JPO-D-20-0229.1
Cornillon, P., Adams, J., Blumenthal, M. B., Chassignet, E., Davis, E., Hankin, S., Kinter, J., Mendelssohn, R., Potemra, J., Srinivasan, A., & Sirott, J. (2009). NVODS and the Development of OPeNDAP. Oceanography, 22 (2), 116–127. https://doi.org/10.5670/oceanog.2009.43
Cornillon, P., Flierl, G., Gallagher, J., & Milkowski, G. (1993). Report on the First Workshop for the Distributed Oceanographic Data System (p. 109). Zenodo. https://doi.org/10.5281/ZENODO.10610992
Donoho, D. (2024). Data Science at the Singularity. Harvard Data Science Review, 6 (1). https://doi.org/10.1162/99608f92.b91339ef
Edwards, P. N. (2006). Meteorology as Infrastructural Globalism. Osiris, 21 (1), 229–250. https://doi.org/10.1086/507143
Fleming, J. R., & Seitchek, C. (2009). Advancing Polar Research and Communicating Its Wonders: Quests, Questions, and Capabilities of Weather and Climate Studies in International Polar Years. In Smithsonian at the poles: Contributions to International Polar Year science. Smithsonian Institution Scholarly Press. https://doi.org/10.5479/si.097884601X.0
Hankin, S. C. (2010). NetCDF-CF-OPeNDAP: Standards for Ocean Data Interoperability and Object Lessons for Community Data Standards Processes. Proceedings of OceanObs’09: Sustained Ocean Observations and Information for Society, 450–458. https://doi.org/10.5270/OceanObs09.cwp.41
Hardy, P., & Rozwadowski, H. (2020). Maury for Modern Times: Navigating a Racist Legacy in Ocean Science. Oceanography, 33 (3). https://doi.org/10.5670/oceanog.2020.302
Houvenaghal, G. T. (1987). The First International Conference on Oceanography (Brussels, 1853). Proceedings of the 4th International Congress on the History of Oceanography. Ocean Sciences: Their History and Relation to Man, Hamburg. https://www.vliz.be/imisdocs/publications/276694.pdf
Losos, D., Ranjbar, S., Hoffman, S., Abernathey, R., Desai, A. R., Otkin, J., Zhang, H., Ryu, Y., & Stoy, P. C. (2025). Rapid changes in terrestrial carbon dioxide uptake captured in near-real time from a geostationary satellite: The ALIVE framework. Remote Sensing of Environment, 324, 114759. https://doi.org/10.1016/j.rse.2025.114759
Maury, M. F. (1853). First International Maritime Conference Held for Devising an Uniform System of Meteorological Observations at Sea—Wikisource, the free online library. https://en.wikisource.org/wiki/First_International_Maritime_Conference_Held_for_Devising_an_Uniform_System_of_Meteorological_Observations_at_Sea
Morris, B. (2023, June 26). WMO Weathered the Cold War, but Can It Survive Capitalism? Eos. https://eos.org/features/wmo-weathered-the-cold-war-but-can-it-survive-capitalism
Prabhat, Kashinath, K., Mudigonda, M., Kim, S., Kapp-Schwoerer, L., Graubner, A., Karaismailoglu, E., von Kleist, L., Kurth, T., Greiner, A., Mahesh, A., Yang, K., Lewis, C., Chen, J., Lou, A., Chandran, S., Toms, B., Chapman, W., Dagon, K., … Collins, W. (2021). ClimateNet: An expert-labeled open dataset and deep learning architecture for enabling high-precision analyses of extreme weather. Geoscientific Model Development, 14 (1), 107–124. https://doi.org/10.5194/gmd-14-107-2021
WMO. (2023). Basic documents (2007 ed). World Meteorological Organization. https://library.wmo.int/records/item/48992-basic-documents-no-1
Zillman, J. (2019). Origin, Impact and Aftermath of WMO Resolution 40 (No. WMO-No. 1244; p. 32). World Meteorological Organization. https://library.wmo.int/records/item/56926-origin-impact-and-aftermath-of-wmo-resolution-40
Forward Deployed Engineer